Ai Overview
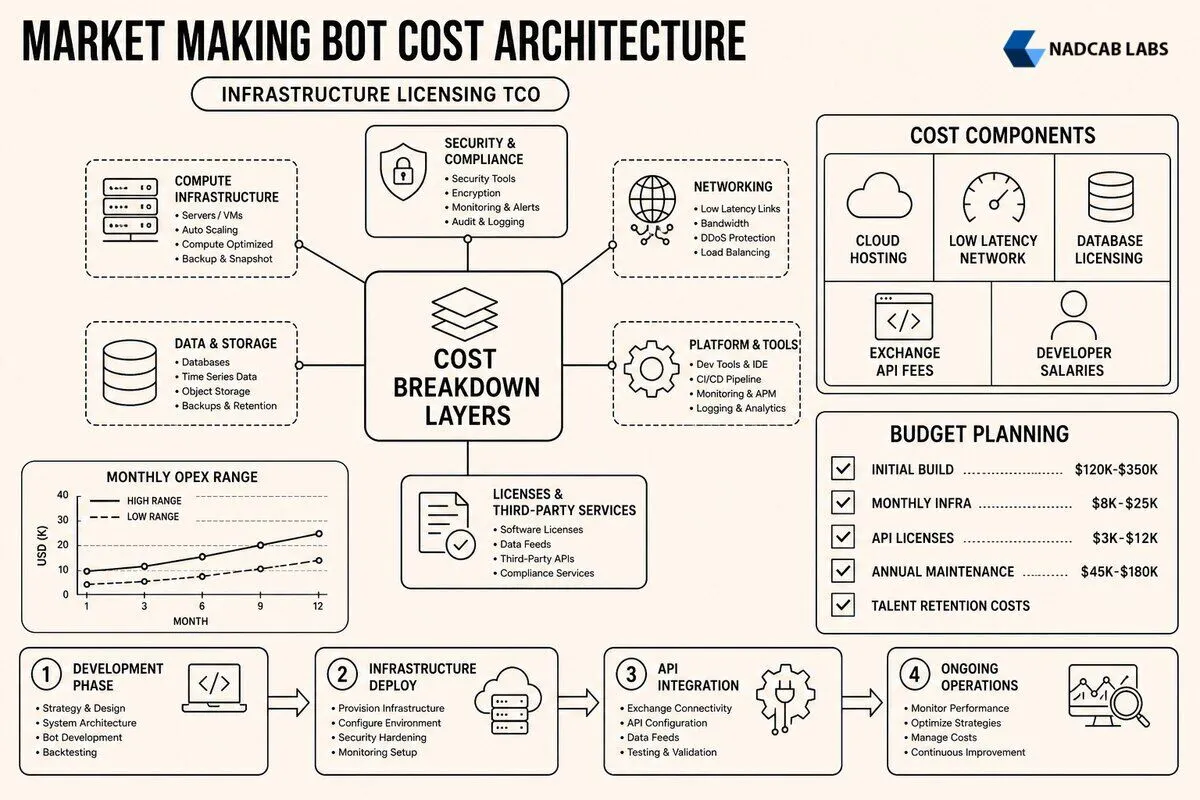
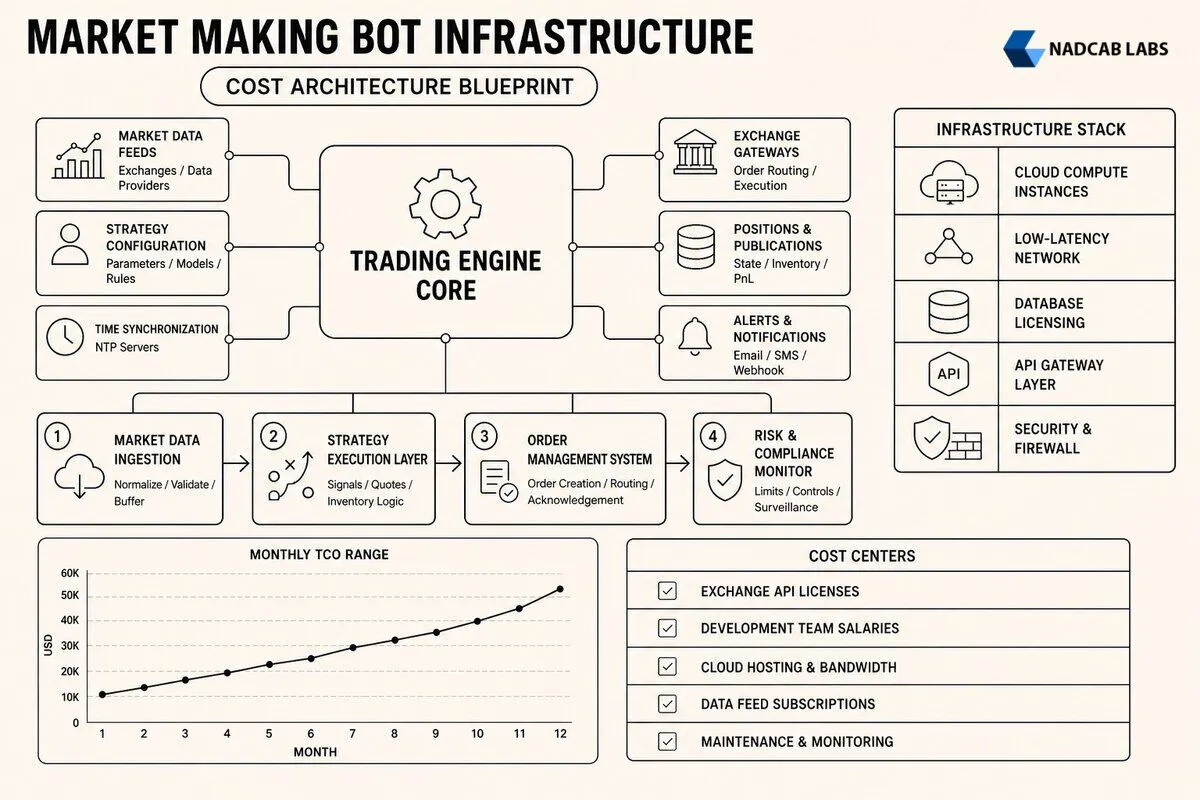
Building a market making bot requires significant capital investment across multiple cost centers: cloud infrastructure, API licensing, development talent, and ongoing maintenance. A typical mid-tier market making bot costs between $120,000 and $350,000 to develop, with annual operational expenses ranging from $45,000 to $180,000 depending on trading volume, asset pairs, and infrastructure requirements.
Building a market making bot requires significant capital investment across multiple cost centers: cloud infrastructure, API licensing, development talent, and ongoing maintenance. A typical mid-tier market making bot costs between $120,000 and $350,000 to develop, with annual operational expenses ranging from $45,000 to $180,000 depending on trading volume, asset pairs, and infrastructure requirements. Understanding the complete market making bot cost breakdown helps teams allocate budgets accurately, avoid hidden expenses, and plan for sustainable profitability.
Key Takeaways
- Infrastructure costs range from $8,000–$25,000 monthly for cloud hosting, low-latency networking, and database licensing
- API licensing fees add $3,000–$12,000 per month depending on exchange tier, data feed quality, and rate limits
- Development teams typically require 3–6 months for MVP delivery, with senior blockchain developers costing $90–$180 per hour
- Ongoing maintenance consumes 20–30% of initial development costs annually for monitoring, algorithm tuning, and compliance
- Break-even timelines average 8–18 months based on spread capture efficiency and trading volume targets
- Total cost of ownership over three years typically ranges from $400,000 to $1.2 million for production-grade systems
What Are the Core Infrastructure Costs for Market Making Bots?
Infrastructure represents the foundation of any high-performance market making operation. The choice between cloud hosting and colocation facilities directly impacts latency, reliability, and monthly expenses. Most teams start with cloud providers like AWS, Google Cloud Platform, or Microsoft Azure for their flexibility and global reach, though colocation near exchange data centers becomes essential for ultra-low-latency strategies.
Cloud hosting tiers vary significantly based on compute requirements and geographic distribution. A basic setup using AWS EC2 c6i.2xlarge instances (8 vCPUs, 16 GB RAM) across three availability zones costs approximately $1,200 monthly per region. Production environments typically deploy across 2–4 regions for redundancy, bringing baseline compute costs to $2,400–$4,800 monthly. Teams requiring sub-millisecond execution often add dedicated instances or bare-metal servers, increasing costs by 40–60%. Colocation alternatives at major exchange hubs like Equinix NY4 or LD5 start at $1,500 monthly per rack unit plus cross-connect fees of $200–$500 per exchange connection.
Database infrastructure demands careful planning for both real-time tick data and historical analytics. PostgreSQL with TimescaleDB extensions handles time-series order book data efficiently, requiring managed database instances starting at $800 monthly for 500 GB storage with automatic backups. High-frequency strategies processing millions of ticks daily need larger instances (db.r5.4xlarge or equivalent) costing $2,200–$3,500 monthly. Real-time data streaming infrastructure using Apache Kafka or Redis adds another $600–$1,800 monthly depending on message throughput and retention policies.
Network bandwidth and security infrastructure protect against both performance degradation and malicious attacks. DDoS protection through Cloudflare Enterprise or AWS Shield Advanced costs $3,000–$5,000 monthly but prevents costly downtime during attacks. Multi-region redundancy requires dedicated VPN tunnels or AWS Transit Gateway configurations adding $400–$900 monthly. Teams targeting 99.99% uptime (less than 4.38 minutes downtime monthly) invest in automated failover systems and health monitoring, which together consume an additional $1,200–$2,000 in infrastructure and tooling costs.
Monthly Infrastructure Cost Breakdown
For teams exploring comprehensive solutions, partnering with a Market Making Software development firm can optimize infrastructure choices based on trading strategy requirements and budget constraints.
How Do API Licensing Fees Impact Total Development Budget?
Exchange API access represents one of the most variable and often underestimated cost components in market making bot development. Rate limits, data feed quality, and WebSocket subscription models create a complex pricing landscape that directly affects both development timelines and operational capabilities. Understanding these costs upfront prevents budget overruns and ensures adequate data access for strategy execution.
Exchange API rate limits typically operate on tiered pricing models tied to trading volume or subscription level. Binance’s standard API allows 1,200 requests per minute for free, but market makers executing hundreds of orders per second require VIP tier access starting at $10,000 monthly trading volume with reduced fees and higher rate limits. Coinbase Pro charges $0–$50 monthly for basic access but premium WebSocket feeds with full order book depth cost $500–$2,000 monthly depending on asset pairs. Kraken’s institutional API tier, essential for sub-100ms order placement, requires $50,000 minimum monthly volume or a flat $3,000 subscription fee.
Market data vendor fees add substantial recurring costs for teams requiring normalized, aggregated, or historical data. CoinMarketCap’s professional API starts at $599 monthly for 10,000 calls daily, while enterprise tiers supporting real-time streaming across 300+ exchanges cost $2,999 monthly. CryptoCompare’s institutional data feeds range from $1,200 to $8,000 monthly based on asset coverage and update frequency. Proprietary feeds from providers like Kaiko or CoinGecko add $2,500–$12,000 monthly for tick-level historical data and order book snapshots essential for backtesting and strategy validation.
Third-party liquidity aggregator APIs and smart order routing services introduce additional licensing costs but can improve execution quality and reduce slippage. Platforms like 1inch Network or Uniswap V3 offer free basic access, but institutional routing APIs with advanced features cost $1,500–$5,000 monthly. Custom liquidity aggregation requiring direct integration with multiple DEXs and CEXs demands API keys, authentication infrastructure, and often volume-based fee structures that add $800–$3,500 monthly depending on throughput requirements.
| API Service Category | Provider Examples | Monthly Cost Range | Key Features |
|---|---|---|---|
| Exchange API (Premium) | Binance VIP, Coinbase Pro, Kraken Institutional | $500–$3,000 | Higher rate limits, WebSocket priority, dedicated support |
| Market Data Aggregators | CoinMarketCap, CryptoCompare, Messari | $600–$8,000 | Normalized data, cross-exchange analytics, historical archives |
| Proprietary Data Feeds | Kaiko, CoinGecko Enterprise, Nomics | $2,500–$12,000 | Tick-level data, order book depth, trade reconstruction |
| Liquidity Aggregation | 1inch, Paraswap, Matcha (0x API) | $800–$5,000 | Smart routing, MEV protection, multi-DEX access |
| Blockchain Node Access | Infura, Alchemy, QuickNode | $300–$2,000 | Archive nodes, WebSocket subscriptions, enhanced APIs |
Similar to how RPA implementation cost breakdown requires careful analysis of licensing tiers, market making bot budgets must account for API cost scaling as trading volume and asset coverage expand.
What Are the Development Team Expenses and Timeline Factors?
Human capital represents the largest single expense category in custom market making bot development. Team composition, geographic location, and project duration create wide cost variance between minimal viable products and enterprise-grade solutions. Understanding these factors helps organizations choose between in-house development, outsourcing, or hybrid models.
Blockchain developer salaries vary significantly by experience level and specialization. Senior blockchain engineers with 5+ years experience in DeFi protocols and algorithmic trading command $140–$180 per hour in North America, $90–$130 in Western Europe, and $50–$80 in Eastern Europe or Asia. Mid-level developers with 2–4 years experience cost $80–$120, $60–$90, and $35–$60 respectively across these regions. A typical development team requires 2–3 blockchain developers, one quantitative analyst ($100–$150 hourly), and one DevOps engineer ($70–$110 hourly) for infrastructure automation and deployment pipelines.
Project duration directly impacts total development costs through team allocation and scope complexity. A minimal viable product focusing on single-exchange market making with basic inventory management requires 3–4 months with a team of 3–4 engineers, totaling $120,000–$200,000 in labor costs. Mid-tier solutions supporting multi-exchange operations, advanced risk controls, and custom algorithm frameworks extend to 5–7 months and $250,000–$400,000. Enterprise implementations with cross-chain liquidity aggregation, machine learning optimization, and institutional-grade compliance monitoring span 9–12 months and $500,000–$850,000 in development expenses.
Outsourcing versus in-house trade-offs extend beyond hourly rates to include knowledge transfer overhead, communication efficiency, and long-term maintenance capabilities. Outsourcing to specialized firms reduces upfront costs by 30–40% and accelerates time-to-market through proven frameworks and reusable components. However, knowledge transfer gaps create dependencies that increase maintenance costs by 15–25% annually. In-house teams maintain full intellectual property control and faster iteration cycles but require 6–9 months for domain expertise development, adding $80,000–$150,000 in learning curve costs.
Market Making Bot Development Process Flow
Just as entertainment app development cost breakdown varies by feature complexity and platform requirements, market making bot expenses scale with the number of supported exchanges, asset pairs, and algorithmic sophistication.
Which Ongoing Maintenance and Operational Costs Should Teams Budget For?
Post-deployment operational costs often surprise teams who focus exclusively on initial development budgets. Continuous monitoring, algorithm refinement, and regulatory compliance create recurring expenses that typically consume 20–30% of initial development costs annually. Proper budgeting for these operational realities ensures long-term system reliability and profitability.
24/7 monitoring infrastructure prevents costly downtime and detects performance degradation before it impacts profitability. Tools like Datadog or New Relic cost $180–$450 monthly per host for comprehensive application performance monitoring, log aggregation, and custom dashboards. Prometheus and Grafana offer open-source alternatives but require dedicated DevOps time for configuration and maintenance, typically 10–15 hours monthly at $70–$110 hourly rates. Incident response protocols including PagerDuty or Opsgenie add $90–$250 monthly for on-call scheduling and alert routing. System health dashboards tracking order fill rates, spread capture, and inventory exposure require custom development consuming 20–30 hours quarterly at developer rates.
Algorithm tuning and strategy optimization represent ongoing labor costs essential for maintaining competitive edge. Market conditions change continuously, requiring parameter adjustments, spread recalibration, and risk limit updates. Quantitative analysts spend 15–25 hours monthly on performance analysis and strategy refinement, costing $1,500–$3,750 monthly. Backtesting compute resources for testing parameter changes consume $300–$800 monthly in cloud costs for historical data processing and simulation runs. Performance optimization cycles addressing latency bottlenecks or execution quality issues occur quarterly, requiring 40–60 developer hours at $80–$140 hourly rates.
Compliance audit fees and security testing protect against regulatory penalties and system vulnerabilities. Annual security penetration testing by firms like Trail of Bits or Quantstamp costs $15,000–$35,000 depending on codebase size and complexity. Quarterly compliance reviews for jurisdictions requiring market maker registration (US, EU, Singapore) consume 20–30 legal hours at $250–$450 hourly rates. Regulatory reporting infrastructure for trade surveillance, position reporting, and audit trail maintenance requires dedicated database storage and export tools adding $400–$1,200 monthly in infrastructure and development costs.
Similar to modular blockchain cost considerations, market making maintenance budgets must account for component upgrades, security patches, and performance enhancements as the ecosystem evolves.
| Operational Cost Category | Monthly Range | Annual Range | Frequency |
|---|---|---|---|
| Monitoring & Alerting Tools | $500–$1,200 | $6,000–$14,400 | Continuous |
| Algorithm Tuning Labor | $1,500–$3,750 | $18,000–$45,000 | Monthly |
| Backtesting Compute | $300–$800 | $3,600–$9,600 | Continuous |
| Performance Optimization | $2,700–$5,600 | $8,000–$17,000 | Quarterly |
| Security Penetration Testing | — | $15,000–$35,000 | Annual |
| Compliance & Legal Reviews | $1,700–$3,400 | $5,000–$10,000 | Quarterly |
| Regulatory Reporting Infrastructure | $400–$1,200 | $4,800–$14,400 | Continuous |
| Total Annual Operational Costs | — | $60,400–$145,400 | — |
Implementing gas optimization techniques reduces on-chain transaction costs for DEX market making, directly improving net profitability and shortening ROI timelines.
How Do You Calculate ROI and Total Cost of Ownership for Market Making Bots?
Return on investment analysis for market making bots requires modeling both revenue generation through spread capture and total cost of ownership across multi-year horizons. Accurate financial projections account for trading volume ramp-up, inventory risk, and infrastructure scaling costs as operations expand. Understanding these dynamics helps teams set realistic profitability expectations and make informed build-versus-buy decisions.
Break-even analysis starts with spread capture assumptions based on asset volatility and competition intensity. A bot trading $5 million daily volume across BTC/USDT, ETH/USDT, and SOL/USDT pairs with average captured spreads of 0.08% generates $4,000 daily revenue or $120,000 monthly. Subtracting exchange fees (typically 0.02–0.04% per side), infrastructure costs ($8,000–$15,000 monthly), API licensing ($3,000–$8,000), and operational expenses ($5,000–$12,000) yields net monthly profit of $82,000–$104,000. Against initial development costs of $200,000–$350,000, break-even occurs in 2.4–4.3 months under optimal conditions.
However, realistic projections account for volume ramp-up periods and market condition variability. Most teams achieve only 30–40% of target volume in month one, scaling to 70–80% by month three and full capacity by month five. This creates an extended break-even timeline of 8–14 months for mid-tier implementations. Inventory risk management efficiency significantly impacts profitability—poor inventory controls can reduce net spread capture by 20–35% through adverse selection and position losses. Advanced risk models using value-at-risk calculations and dynamic hedging add $15,000–$30,000 in development costs but improve risk-adjusted returns by 15–25%.
Total cost of ownership modeling over 3–5 year horizons reveals the complete financial picture including depreciation, upgrade cycles, and scalability investments. A typical TCO breakdown for a mid-tier market making bot includes: initial development ($200,000–$350,000), first-year operational costs ($60,000–$145,000), annual infrastructure scaling (10–15% growth), algorithm enhancement cycles every 6–9 months ($25,000–$50,000 each), and major platform upgrades every 18–24 months ($40,000–$80,000). Over three years, cumulative TCO ranges from $450,000 to $850,000, while five-year projections reach $700,000 to $1.4 million.
Cost-benefit comparison of build versus buy decisions weighs upfront savings against long-term flexibility and control. White-label market making solutions from vendors like Hummingbot or CCXT Pro cost $2,000–$8,000 monthly with limited customization, totaling $72,000–$288,000 over three years. Custom development provides full intellectual property ownership, tailored algorithms, and unlimited scalability but requires 3–6 months before revenue generation begins. Hybrid deployment models combining open-source frameworks with custom strategy modules reduce initial development costs by 25–40% while maintaining competitive differentiation.
Similar to how EHR interoperability blockchain cost analysis requires multi-year TCO modeling, market making bot financial planning must account for infrastructure evolution, regulatory changes, and competitive pressures over extended time horizons.
Three-Year TCO Comparison by Deployment Model
Note: White-label solutions offer lower upfront costs but limited customization and ongoing vendor dependency; custom builds provide maximum flexibility at higher initial investment.
Understanding smart contract architecture for real estate tokenization principles helps teams building DEX market makers design efficient on-chain components that minimize gas costs and maximize capital efficiency.
For teams evaluating market entry costs, reviewing exchange listing cost breakdown data provides context on the broader ecosystem expenses beyond bot development, including listing fees, legal compliance, and ongoing exchange relationship management.
Accurate market making bot cost breakdown analysis requires granular understanding of infrastructure tiers, API pricing models, development team composition, and multi-year operational expenses. Teams that invest time in comprehensive TCO modeling and ROI scenario planning make better-informed decisions about build-versus-buy trade-offs, resource allocation, and profitability timelines. The most successful implementations balance upfront development quality with operational efficiency, creating sustainable competitive advantages through superior execution and risk management rather than purely cost minimization.
Organizations seeking to deploy production-grade market making systems should partner with experienced development teams that understand both the technical architecture and the financial realities of algorithmic trading. Proper budget planning, realistic timeline expectations, and ongoing investment in algorithm refinement separate profitable market making operations from undercapitalized experiments that fail to achieve sustainable returns.
Frequently Asked Questions
Q1.What is the average cost to develop a market making bot from scratch?
Developing a market making bot from scratch typically costs $50,000–$200,000 depending on complexity. Basic single-exchange bots start around $50K, while multi-exchange systems with advanced risk management, latency optimization, and custom algorithms can exceed $150K. Costs include architecture design, order execution logic, API integrations, backtesting infrastructure, and security audits. Teams must budget for ongoing development iterations as market conditions evolve.
Q2.How much do exchange API fees add to monthly operational expenses?
Exchange API fees vary widely: centralized exchanges charge 0.02%–0.1% per trade (maker fees often lower), while DEX aggregators may cost 0.3%–0.5% plus gas. High-frequency strategies executing 10,000+ trades monthly can incur $2,000–$15,000 in fees alone. Premium API tiers for reduced latency or higher rate limits add $500–$5,000 monthly. Volume-based discounts significantly reduce costs for established market makers.
Q3.What infrastructure setup is required for low-latency market making?
Low-latency market making requires colocation or proximity hosting near exchange servers (1–5ms latency), high-performance bare-metal servers with NVMe SSDs, dedicated 10Gbps+ network connections, and redundant failover systems. Hardware costs range $5,000–$20,000 upfront, plus $1,000–$5,000 monthly hosting. Critical components include real-time order book processing, WebSocket feeds, and sub-millisecond execution pipelines. Geographic distribution across multiple data centers ensures uptime and regulatory compliance.
Q4.How do cloud hosting costs scale with trading volume and asset pairs?
Cloud hosting scales linearly with trading volume and asset pairs. A single-pair bot on AWS/GCP costs $200–$800 monthly for moderate compute and storage. Adding 10+ pairs or high-frequency strategies increases costs to $2,000–$10,000 monthly due to higher CPU, memory, and bandwidth demands. Real-time data feeds, historical storage, and redundant instances drive expenses. Optimizing instance types and using reserved capacity can reduce costs by 30–50%.
Q5.What are the hidden costs in market making bot maintenance?
Hidden maintenance costs include exchange API updates requiring code refactoring ($5,000–$15,000 annually), security patches and vulnerability audits ($3,000–$10,000), monitoring and alerting infrastructure ($500–$2,000 monthly), and compliance reporting tools. Unexpected downtime or slippage losses during market volatility can cost thousands per incident. Teams often underestimate ongoing developer time for strategy tuning, bug fixes, and performance optimization, adding $50,000–$100,000 annually in labor.
Q6.How long does it take to achieve ROI on a custom market making bot?
ROI timelines range from 6–24 months depending on market conditions, trading volume, and spread capture efficiency. Bots generating 0.5–2% monthly returns on deployed capital ($500K+) typically break even in 12–18 months after covering development, infrastructure, and operational costs. High-volatility markets accelerate ROI, while low-liquidity pairs extend timelines. Continuous strategy optimization and risk management are critical to sustaining profitability beyond initial deployment.
Explore Services
Related Services
Reviewed by

Wazid Khan
Director & Co-Founder
Wazid Khan is the Director & Co-Founder of Nadcab Labs, a forward-thinking digital engineering company specializing in Blockchain, Web3, AI, and enterprise software solutions. With a strong vision for innovation and scalable technology, Wazid has played a key role in building Nadcab Labs into a trusted global technology partner. His expertise lies in strategic planning, business development, and delivering client-centric solutions that drive real-world impact. Under his leadership, the company has successfully delivered numerous projects across industries such as fintech, healthcare, gaming, and logistics. Wazid is passionate about leveraging emerging technologies to create secure, efficient, and future-ready digital ecosystems for businesses worldwide.