
Ai Overview
The Nakamoto Coefficient is the smallest number of independent participants in a blockchain network who, if they all secretly decided to work together against the rules, could successfully disrupt the network’s operation. Think of it like the minimum number of people who could, theoretically, take over a distributed organization if they all colluded at the same moment.
Key Takeaways
- 01
The Nakamoto Coefficient is the minimum number of independent entities that must collude to gain control over a blockchain network and disrupt or compromise its normal operation. - 02
It was introduced in 2017 by Balaji Srinivasan, former CTO of Coinbase, and named after Satoshi Nakamoto as a tribute to Bitcoin’s foundational goal of decentralized power distribution across participants. - 03
Calculation ranks entities by control share from largest to smallest, then counts how many are needed to cumulatively cross the critical threshold, which is 33 percent for PoS and 51 percent for PoW. - 04
A higher Nakamoto Coefficient indicates greater decentralization and resilience, while a lower coefficient signals dangerous concentration of control that could allow censorship or double-spend attacks. - 05
The metric is applied separately to different subsystems including validators, miners, node operators, client software teams, and governance token holders to produce a comprehensive decentralization profile. - 06
Polkadot has historically maintained one of the highest Nakamoto Coefficients among major blockchains due to its Nominated Proof of Stake mechanism distributing stake across hundreds of active validators. - 07
Bitcoin measured by mining pool concentration scores between 3 and 5, meaning as few as three to five large mining pools could collectively control majority hash rate if they chose to collude. - 08
The Nakamoto Coefficient is dynamic and changes as validator sets grow or shrink, stake concentrates or disperses, and hash rate distribution shifts between mining pools across different time periods. - 09
Indian blockchain investors, researchers, and enterprise teams evaluating networks for production deployment should always check the Nakamoto Coefficient before committing to any network as critical infrastructure. - 10
Blockchain projects can improve their Nakamoto Coefficient by incentivizing more validators, capping maximum stake per validator, distributing node infrastructure geographically, and diversifying client software implementations.
What is the Nakamoto Coefficient in Simple Words
The Nakamoto Coefficient is the smallest number of independent participants in a blockchain network who, if they all secretly decided to work together against the rules, could successfully disrupt the network’s operation. Think of it like the minimum number of people who could, theoretically, take over a distributed organization if they all colluded at the same moment. The higher this number, the more people would need to agree to do something harmful, which means the network is more secure against coordinated attacks, censorship, or manipulation.
In practical terms, the Nakamoto Coefficient answers a fundamental question about any blockchain: how decentralized is it really? When a project says it is decentralized, does that mean one thousand people each have tiny control, or does it mean fifty entities divide nearly all the power among themselves while thousands of smaller participants have negligible influence? The Nakamoto Coefficient cuts through that ambiguity by ignoring the long tail of powerless participants and focusing only on how concentrated real economic or computational control is at the top of the distribution.
For Indian blockchain engineers and investors evaluating networks for enterprise deployment, DeFi participation, or long-term capital allocation, the Nakamoto Coefficient is one of the first numbers worth checking. A network with a coefficient of 3 means three entities could theoretically collude to disrupt everything. A network with a coefficient of 50 requires fifty independent parties to agree before any disruption is possible, making coordinated attacks dramatically more difficult to organize and execute across jurisdictions and competing commercial interests.
Who Created the Nakamoto Coefficient and Why
The Nakamoto Coefficient was introduced by Balaji Srinivasan in 2017 when he was serving as the Chief Technology Officer of Coinbase. Srinivasan published a detailed analysis titled “Quantifying Decentralization” in which he argued that the blockchain industry needed a rigorous, quantitative metric for decentralization rather than relying on subjective claims that any given network was or was not decentralized. At the time, numerous projects were making strong decentralization claims in their marketing materials without providing any measurable evidence to support those claims. The industry needed a number, not a philosophy.
Srinivasan chose to name the metric after Satoshi Nakamoto because Bitcoin’s design, as described in the original 2008 whitepaper, was motivated by the desire to create a financial system where no central authority held control. Naming the decentralization metric after the person who created the first practically successful implementation of this idea was both a tribute and a conceptual statement that decentralization, as Nakamoto envisioned it, should be measurable and accountable rather than assumed or claimed.
The motivation for creating the metric was also practical. Srinivasan and other serious blockchain researchers recognized that decentralization is not binary; it exists on a continuous spectrum. A network with one hundred validators where the top three control 60 percent of stake is far more centralized than one where control is evenly distributed across all one hundred. Simple node counts or validator counts failed to capture this distribution. The Nakamoto Coefficient, by focusing on the minimum colluding set rather than the total participant count, captured the economically meaningful dimension of decentralization that earlier metrics missed entirely.
How the Nakamoto Coefficient is Calculated in Blockchain
The calculation of the Nakamoto Coefficient follows a clear and reproducible four-step process that can be applied to any subsystem of a blockchain network. The key input is an ordered list of all participants in the relevant subsystem, along with each participant’s share of the total control resource being measured. For a proof of stake validator set, this is the share of total staked tokens. For a proof of work mining network, this is the share of total hash rate. For a governance system, this is the share of total voting power held by each address or entity.
Step one: identify and list all relevant entities in the subsystem being evaluated. Step two: rank these entities from highest to lowest by their share of control. Step three: starting from the entity with the largest share, add their shares cumulatively until the running total crosses the critical threshold. For proof of stake chains, this threshold is typically 33 percent because controlling one-third of stake is sufficient to halt finality in Byzantine fault-tolerant consensus systems. For proof of work chains, the threshold is 51 percent because majority hash rate is what is needed to execute a successful attack. Step four: count how many entities you added to reach the threshold. That count is the Nakamoto Coefficient.[1]
A simple worked example makes this concrete. Imagine a proof of stake network with five validators controlling 25 percent, 20 percent, 18 percent, 15 percent, and 22 percent of total stake respectively. Ranking from largest to smallest gives: 25, 22, 20, 18, 15. Adding from the top: 25 plus 22 equals 47, which already exceeds 33. So only two validators need to collude to control over one third of the stake. The Nakamoto Coefficient for this network is 2, which is a dangerously low score indicating extreme centralization that should concern any investor or user relying on this network for important transactions.
What Does a High and Low Nakamoto Coefficient Mean
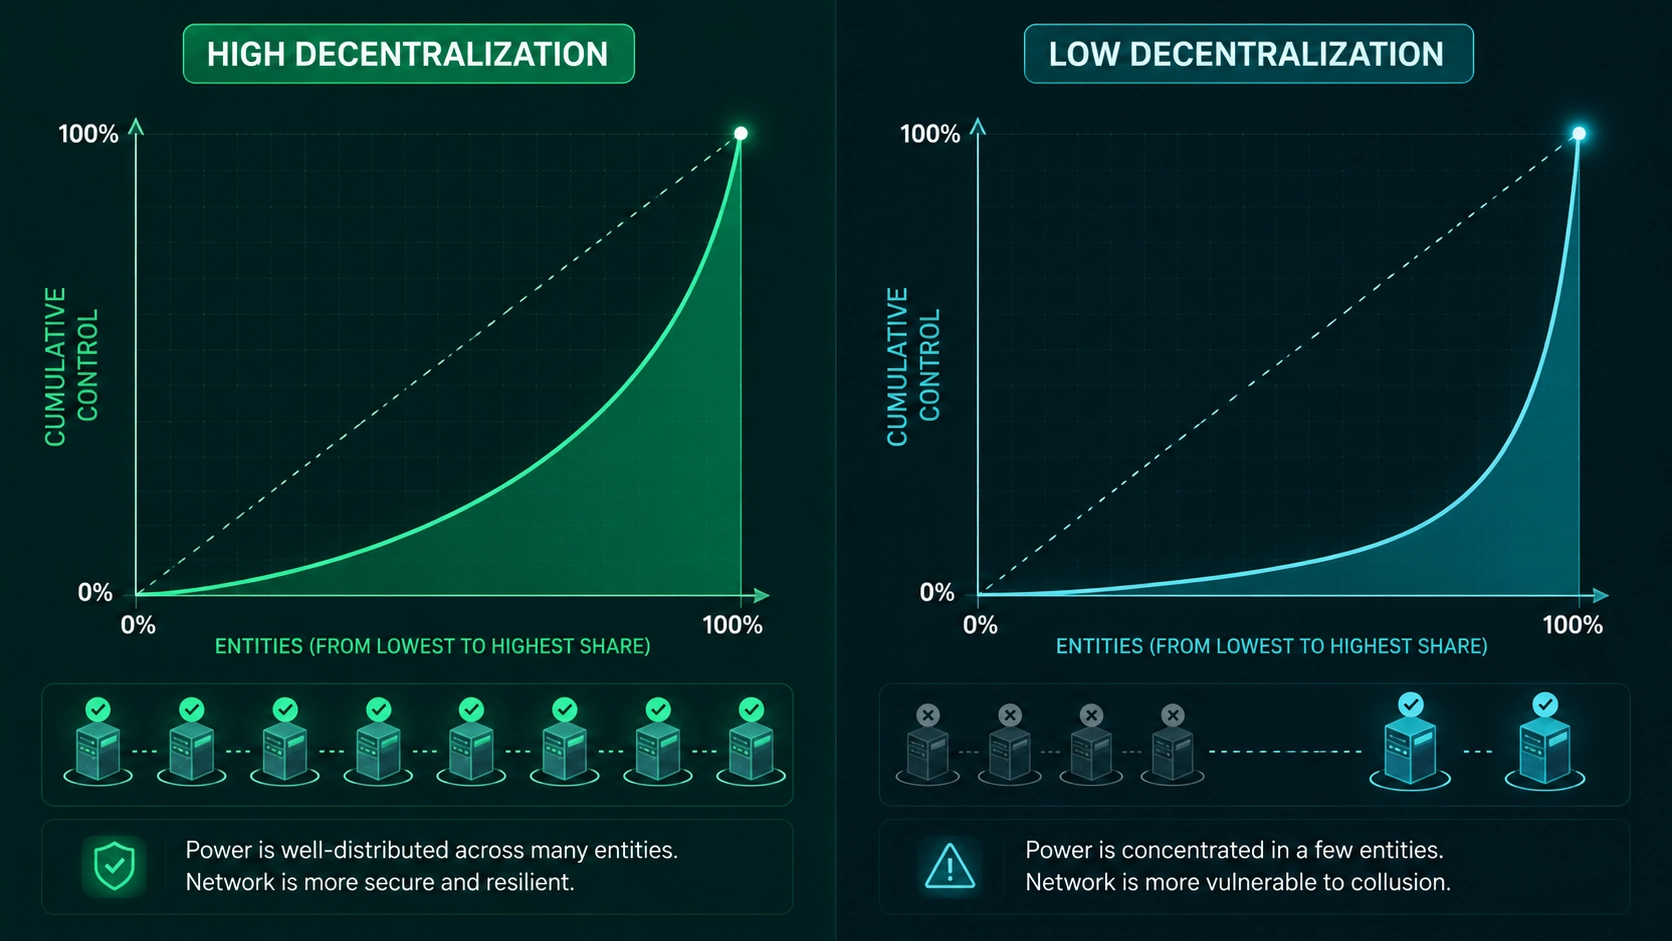
A high Nakamoto Coefficient is unambiguously good for a decentralized network. It means that a larger number of independent entities, each with different commercial interests, different legal jurisdictions, different technical infrastructure, and different political allegiances, would all need to be simultaneously compromised or persuaded to act against the network’s rules before any coordinated attack could succeed. The logistical and economic difficulty of organizing such large-scale collusion across diverse global participants is enormous, making the network practically resilient even if it is theoretically possible to attack it with sufficient coordination.
A low Nakamoto Coefficient, particularly anything below 5, is a serious warning signal. It means that a small group of entities, potentially already in regular communication with each other through business relationships or shared infrastructure, could coordinate to disrupt the network without needing to recruit large numbers of participants. For a blockchain network serving as infrastructure for financial transactions, DeFi protocols, or on-chain asset tokenization, a low coefficient means that a regulatory order targeting a single large staking provider or mining pool could inadvertently compromise the entire network’s liveness or security.
The intermediate range between 5 and 20 represents a zone where the risk is real but the coordination required for an attack is meaningfully challenging. Most serious blockchain networks in production fall somewhere in this range, and the goal of ongoing network governance and protocol design should be to push the coefficient steadily higher over time as the network matures, attracts more validators, and distributes control more evenly across a growing global participant base that increasingly includes emerging market participants from India and other growth regions.
Why the Nakamoto Coefficient is Important for Blockchain Security
Blockchain security is not just about the strength of cryptographic algorithms or the quality of the code. The most technically sophisticated consensus mechanism in the world offers weak guarantees if control over its critical resources is concentrated in too few hands. The Nakamoto Coefficient is the metric that bridges the gap between theoretical protocol security and the real-world power distribution that determines whether a network can withstand coordinated attacks, regulatory pressure, or infrastructure failures that disproportionately affect a small number of powerful participants.
Consider the security implications of a blockchain with a Nakamoto Coefficient of 3. This means three entities together control enough stake or hash rate to disrupt the network. If a major government issues a regulatory order requiring these entities to censor specific addresses or halt transaction processing, compliance by just three parties could be sufficient to violate the network’s fundamental guarantees. If one of these entities is compromised by a sophisticated attacker who also compromises a second entity, a coordinated attack becomes possible with fewer victims than most security models would consider catastrophic. The coefficient quantifies exactly this regulatory and attack surface risk.
For Indian enterprise clients evaluating blockchain networks for supply chain integrity, financial inclusion applications, or identity management systems, the Nakamoto Coefficient provides a security dimension that technical audits of smart contract code alone cannot capture. A blockchain with perfectly audited contracts but a coefficient of 4 is less secure for production enterprise use than a blockchain with minor code inefficiencies but a coefficient of 40, because the fundamental censorship and attack resistance of the network is the foundation that everything else depends upon for real-world reliability across multi-year production deployments.
How the Nakamoto Coefficient Measures Decentralization in Blockchain
The Nakamoto Coefficient measures decentralization not by counting participants but by measuring power concentration. This distinction is critical. A network with ten thousand validators where the top five control 70 percent of total stake has ten thousand participants but the Nakamoto Coefficient for its consensus security is still very low. Conversely, a network with only fifty validators whose stake is distributed nearly perfectly evenly has far fewer participants but a much higher coefficient because disrupting it requires coordinating a much larger fraction of that distributed validator set.
The metric is typically calculated independently for several distinct subsystems of a blockchain and the overall network decentralization score is taken as the minimum across all measured subsystems. These subsystems commonly include: the consensus layer where validators or miners hold stake or hash rate, the networking layer where node operators control peer connections, the client software layer where implementation teams control which code runs on nodes, the governance layer where token holders determine protocol upgrades, and the exchange liquidity layer where platform operators control access to the token market. A network might score 50 on validator decentralization but score 2 on client software because over 95 percent of nodes run a single client implementation maintained by one team.
This multi-subsystem approach reveals an important insight about blockchain design: achieving high decentralization across all subsystems simultaneously is extremely difficult. Most blockchains have some subsystem where control is more concentrated than others, and identifying that weakest link through Nakamoto Coefficient analysis for each subsystem is the honest way to communicate network security trade-offs to users, investors, and regulators who need accurate information to make informed decisions about their participation in the network ecosystem.
Nakamoto Coefficient of Bitcoin Ethereum and Other Major Blockchains
Comparing Nakamoto Coefficients across major blockchain networks reveals significant differences in decentralization levels that are rarely discussed openly in project marketing materials. These differences matter practically for anyone selecting a network for use as the foundation of a financial product, enterprise application, or long-term asset tokenization platform. The numbers below represent approximate values based on publicly available data and research published in 2025 and 2026, with the understanding that these scores change over time as validator sets evolve.
Bitcoin’s Nakamoto Coefficient when measured by mining pool concentration sits between 3 and 5, meaning three to five large mining pools collectively control majority hash rate. This is a reflection of the industrialization of Bitcoin mining rather than any protocol flaw. When measured by individual full node operator count, Bitcoin’s score rises dramatically into the thousands, illustrating how the choice of subsystem and threshold fundamentally changes the number produced. Ethereum post-merge measured by validator stake concentration scores higher than Bitcoin in consensus terms, though liquid staking provider concentration, particularly Lido’s dominance, has been a point of concern in the Ethereum community throughout 2024 and 2025.
| Blockchain | Consensus Type | Approx Coefficient | Subsystem Measured | Key Observation |
|---|---|---|---|---|
| Bitcoin | Proof of Work | 3 to 5 | Mining Pools | Mining pool concentration remains key risk |
| Ethereum | Proof of Stake | 4 to 7 | Validator Stake | Lido concentration is ongoing community concern |
| Polkadot | NPoS | 100+ | Validators | NPoS distributes stake very evenly among validators |
| Solana | Proof of Stake | 5 to 10 | Validators | Top validators hold significant stake concentration |
| Cardano | Proof of Stake | 25 to 40 | Stake Pools | Saturation mechanism limits individual pool growth |
| Avalanche | Proof of Stake | 15 to 25 | Validators | Reasonable distribution but improving steadily |
What Happens When the Nakamoto Coefficient is Too Low
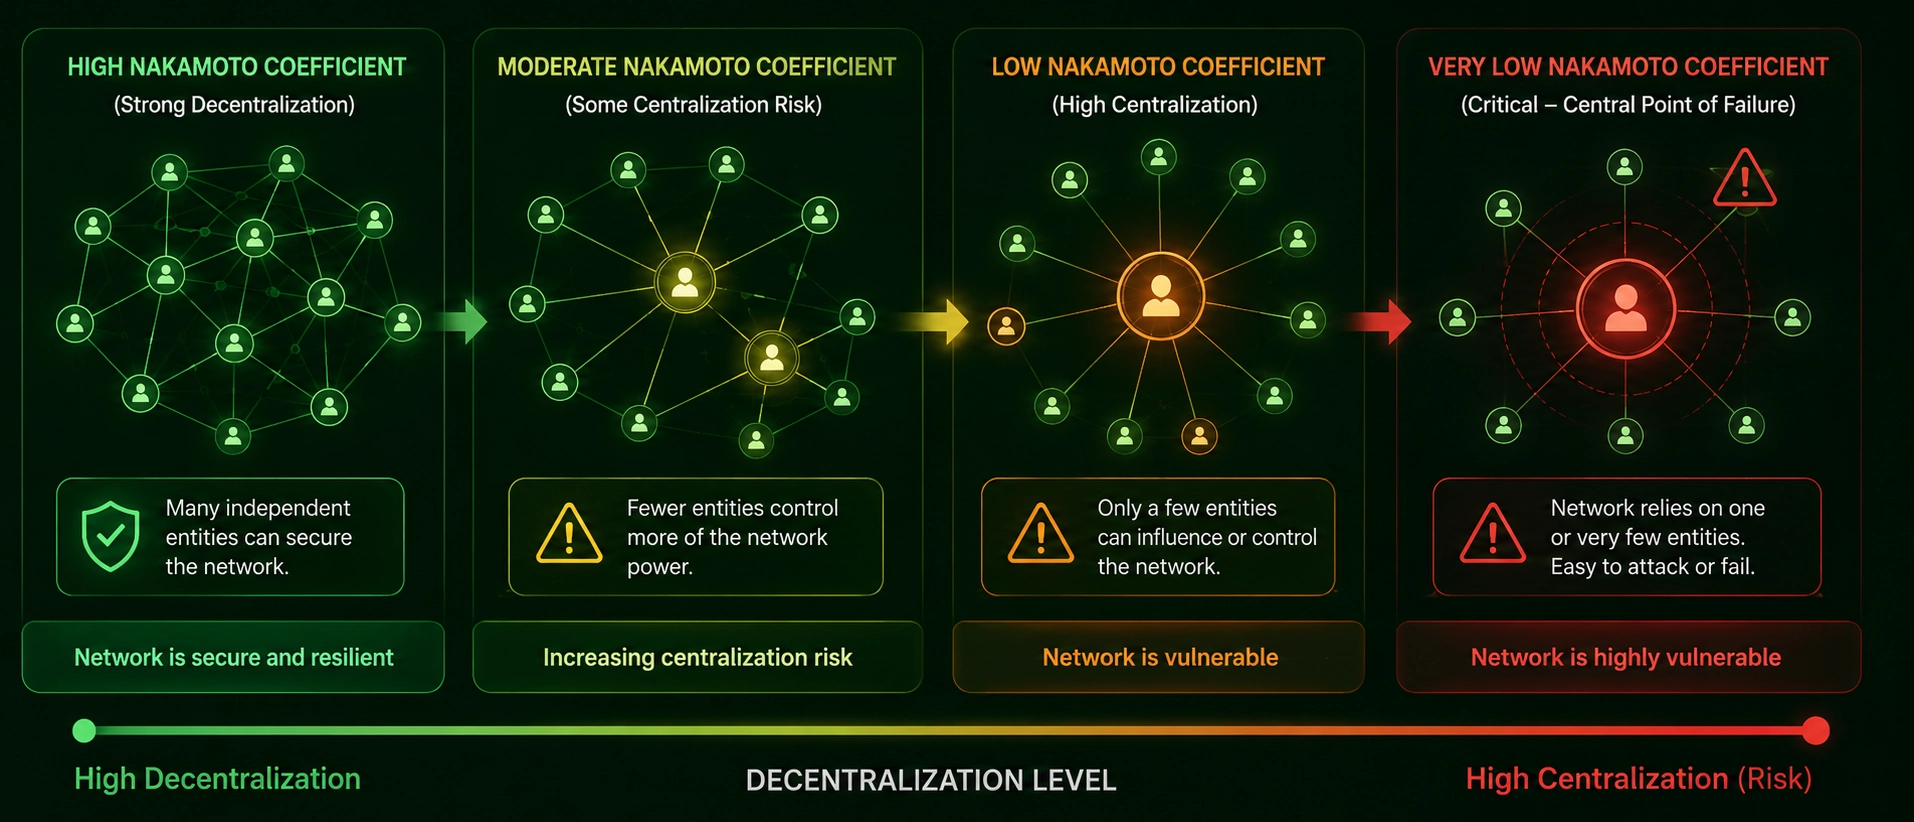
When a blockchain’s Nakamoto Coefficient falls to dangerously low levels, several categories of risk become practically significant rather than theoretical concerns. The first and most direct risk is a consensus attack. When only three or four validators or mining pools control enough resources to exceed the critical threshold, they can potentially coordinate to halt the network’s finality, reorganize recent blocks, or selectively censor specific addresses from having their transactions included. Any of these actions would violate the core promises that blockchain networks make to their users and would likely trigger an immediate crisis of confidence in the network.
The second risk is regulatory capture. Governments in major jurisdictions can issue orders to specific identifiable entities compelling them to comply with censorship requirements or network interference. When a network’s critical threshold can be exceeded by a small number of registered businesses operating in regulated jurisdictions, a coordinated regulatory action, even one not specifically targeting the blockchain itself, could effectively compromise the network’s censorship resistance. This risk is particularly relevant for networks where a significant fraction of validators are registered corporations in any single major regulatory jurisdiction.
Infrastructure concentration is the third failure mode associated with low Nakamoto Coefficients. If the entities that make up the minimum colluding set all rely on the same cloud provider, the same internet exchange, or the same data centre region, a technical outage at that shared infrastructure could inadvertently cause the network to lose consensus even without any malicious intent. Several high-profile proof of stake network outages have occurred for exactly this reason, where sufficient validators were co-located on AWS US-East-1 that a regional outage dropped the network below its liveness threshold and caused block production to halt temporarily.
How Blockchain Projects Can Improve Their Nakamoto Coefficient
Improving a blockchain network’s Nakamoto Coefficient requires deliberate protocol design choices, economic incentive adjustments, and active community outreach that together reduce concentration of control across the relevant subsystems. There is no single silver bullet; improving decentralization requires sustained attention to multiple dimensions of the network architecture simultaneously, and some improvements involve genuine trade-offs against other desirable properties like performance or capital efficiency that make these decisions genuinely difficult for protocol governance teams.
The most impactful interventions are typically at the consensus layer. Validator saturation mechanisms, as implemented in Cardano, cap the total stake that can delegate to any single pool before the reward efficiency starts diminishing, incentivizing delegators to spread their stake across more pools rather than concentrating in the largest and most recognizable ones. Maximum validator commission caps prevent dominant validators from extracting excess fees that would allow them to reinvest disproportionate amounts into growing their stake share. New validator bootstrapping programmes that provide initial stake or fee waivers to promising validators from underrepresented geographies, including India and Southeast Asia, directly expand the geographic and organizational diversity of the validator set.
At the client software layer, funding multiple independent client implementations is a long-term decentralization investment. Ethereum’s sustained effort to maintain multiple execution and consensus clients, including Geth, Besu, Nethermind, Lighthouse, Prysm, and others, ensures that no single software team can unilaterally determine how the network behaves through a code change that all nodes would be forced to adopt simultaneously. For Indian blockchain protocol teams building new networks, investing in multiple client implementations from the earliest possible stage, rather than treating it as a future optimization, produces compounding decentralization benefits as the network scales over time.
Nakamoto Coefficient vs Other Decentralization Metrics
The Nakamoto Coefficient is not the only metric used to evaluate blockchain decentralization, and comparing it to alternative approaches helps clarify what it uniquely captures and where its limitations lie. Different metrics focus on different dimensions of decentralization and are best used in combination rather than treating any single metric as the complete picture of a network’s power distribution and resilience characteristics.
The Gini coefficient, borrowed from economic inequality measurement, measures how unequal the distribution of stake or hash rate is across all participants. A Gini coefficient of 0 represents perfect equality and 1 represents total concentration. While useful for visualizing the shape of the distribution, the Gini coefficient does not directly answer the security question of how many entities need to collude to attack the network. Node count metrics simply count the total number of validators or full nodes without accounting for how unevenly control is distributed among them. Geographic distribution metrics measure how many different countries or regions host significant infrastructure, adding a geopolitical dimension to decentralization analysis that the Nakamoto Coefficient does not directly capture.
| Metric | What It Measures | Security Relevant | Main Limitation |
|---|---|---|---|
| Nakamoto Coefficient | Minimum colluding set size for attack | Directly Yes | Varies significantly by subsystem and threshold |
| Gini Coefficient | Inequality of stake or hash rate distribution | Indirectly | Does not answer how many entities to attack |
| Node Count | Total number of validators or full nodes | Weakly | Ignores power concentration among top holders |
| Geographic Distribution | Countries or regions hosting infrastructure | Partially | Does not measure economic control concentration |
| Client Diversity Score | Share of nodes running each client software | Directly Yes | Specific to software layer only, not economic |
Real World Examples of Nakamoto Coefficient in Action
The Nakamoto Coefficient has been applied in several notable real-world contexts that demonstrate both its practical utility and the consequences of ignoring centralization warnings. These examples from blockchain network histories illustrate why tracking this metric continuously rather than checking it once at launch is essential for maintaining honest awareness of network risk over time as participant distributions shift.
GHash.io’s brief crossing of the 51 percent hash rate threshold in Bitcoin in June 2014 was a direct demonstration of a Nakamoto Coefficient of 1 for Bitcoin’s mining subsystem at that specific moment. A single mining pool controlled sufficient hash rate to execute any mining-level attack. The community’s response was immediate: public pressure caused miners to leave the pool, and the industry began developing better tooling for monitoring pool concentration. The incident made the abstract concept of Nakamoto Coefficient urgency viscerally concrete for Bitcoin’s community and remains a frequently cited case study in blockchain security discussions more than a decade later.
Ethereum’s liquid staking provider concentration has produced ongoing Nakamoto Coefficient concerns in the proof of stake era. Lido Finance, a liquid staking protocol, grew to control over 30 percent of all staked ETH at its peak, meaning that a governance attack on Lido’s DAO alone could have a significant impact on Ethereum consensus. The Ethereum Foundation and core researchers publicly raised the alarm, and Lido voluntarily committed to not increasing its market share beyond 33 percent.
This real-world episode illustrates how the Nakamoto Coefficient functions as a policy tool: the threshold is explicit enough that stakeholders can set clear boundaries and hold large participants accountable to them. For Indian blockchain researchers monitoring Ethereum for enterprise use case suitability, this kind of publicly documented threshold commitment provides meaningful governance accountability that complements the quantitative metric itself.
Why Investors and Developers Should Always Check the Nakamoto Coefficient
For blockchain investors, the Nakamoto Coefficient belongs in the due diligence checklist alongside token economics, team credentials, and market size analysis. A blockchain with impressive technology but a Nakamoto Coefficient of 3 carries concentration risk that could materialize suddenly and catastrophically. If those three controlling entities face regulatory action, business failure, or internal disputes, the network could experience consensus failures that cause token values to collapse and DeFi protocols built on top of it to malfunction. Understanding this risk before committing capital is far preferable to discovering it when a network crisis is already unfolding.
For blockchain engineers and enterprise architects evaluating networks for production deployment, the Nakamoto Coefficient is a baseline security requirement rather than an optional consideration. An enterprise blockchain platform serving Indian financial institutions, healthcare networks, or government supply chains needs to operate reliably for years without the risk that a small number of infrastructure providers can be pressured into censoring specific participants or disrupting the network’s operation. Choosing a network with an acceptable Nakamoto Coefficient across all relevant subsystems is a prerequisite for responsible production deployment that respects the security expectations of the organizations relying on the platform.
The Nakamoto Coefficient should be monitored continuously, not just checked once. Networks that launched with healthy coefficients have seen them deteriorate as a few large staking providers accumulated market share or as mining hardware economies of scale concentrated hash rate among a smaller number of industrial operators. Setting up alerts on tools like Chainspect, which tracks real-time Nakamoto Coefficients across more than 50 blockchains, allows investors and enterprise teams to receive warnings when a network’s decentralization is trending in the wrong direction before that deterioration reaches a critical threshold that triggers a public crisis.
For India’s growing institutional blockchain ecosystem, treating the Nakamoto Coefficient as a live operational metric rather than a one-time research finding reflects the kind of professional rigour that the asset class increasingly demands from its most serious participants.
Frequently Asked Questions
Q1.1. What is the Nakamoto Coefficient in simple words?
The Nakamoto Coefficient is a number that tells you the minimum number of independent entities, such as miners or validators, that would need to secretly work together to disrupt or take control of a blockchain network. A higher number means the network is more decentralized and harder to attack or manipulate by any small group.
Q2.2. Who created the Nakamoto Coefficient and when was it introduced?
The Nakamoto Coefficient was introduced in 2017 by Balaji Srinivasan, who was the Chief Technology Officer at Coinbase at the time. He named it after Satoshi Nakamoto, the pseudonymous creator of Bitcoin, as a tribute to the idea of decentralization that Bitcoin was built upon and to give the community a concrete metric for evaluating how well any blockchain network upholds that principle.
Q3.3. How is the Nakamoto Coefficient calculated step by step?
To calculate the Nakamoto Coefficient, you first identify all major entities in the network such as validators or mining pools. You then rank them by their share of control, whether stake or hash rate, from largest to smallest. Starting from the top, you add their shares cumulatively until the total crosses the critical threshold, typically 33 percent for proof of stake or 51 percent for proof of work. The count of entities required to cross that threshold is the Nakamoto Coefficient.
Q4.4. What is a good Nakamoto Coefficient score for a blockchain?
There is no universal agreed threshold, but generally a Nakamoto Coefficient below 5 is considered dangerously centralized, between 5 and 20 is moderate, and above 20 is considered reasonably decentralized. Polkadot has historically maintained scores above 100, Bitcoin typically sits between 3 and 5 measured by mining pools, and Ethereum’s score varies based on validator concentration in the proof of stake era.
Q5.5. Is Bitcoin actually decentralized according to its Nakamoto Coefficient?
Bitcoin’s Nakamoto Coefficient when measured by mining pool concentration is often between 3 and 5, meaning as few as three to five large mining pools could collectively control over 51 percent of the network hash rate if they colluded. However, when measured by individual node count, Bitcoin’s score rises dramatically to the thousands. The answer depends entirely on which subsystem you are measuring and which threshold you apply.
Q6.6. Why does the Nakamoto Coefficient matter for blockchain investors?
Investors use the Nakamoto Coefficient to evaluate network risk. A low coefficient means a small group of entities could disrupt transactions, censor users, or orchestrate a double-spend attack. For Indian investors considering long-term positions in blockchain networks or blockchain-based assets, a low Nakamoto Coefficient signals concentration risk that could undermine the network’s utility and the value of assets built on top of it.
Q7.7. How is the Nakamoto Coefficient different from a 51 percent attack threshold?
The Nakamoto Coefficient and the 51 percent attack concept are closely related but not identical. A 51 percent attack specifically refers to gaining majority hash rate to rewrite transaction history in proof of work networks. The Nakamoto Coefficient is more general: it measures how many entities must collude to disrupt any critical subsystem including governance, validation, networking, or code contribution. It applies to proof of stake, proof of work, and governance systems alike.
Q8.8. What blockchain has the highest Nakamoto Coefficient in 2026?
Polkadot consistently scores among the highest due to its Nominated Proof of Stake mechanism that distributes stake across a large number of active validators. Cosmos Hub, Cardano, and Avalanche have also maintained relatively high scores. Bitcoin scores differently depending on whether you measure mining pools, individual miners, or full node operators, producing very different numbers depending on which subsystem is used as the basis for the calculation.
Q9.9. Can a blockchain improve its Nakamoto Coefficient over time?
Yes, blockchain networks can improve their Nakamoto Coefficient through several mechanisms including actively encouraging more validators or miners to join the network, adjusting staking reward structures to discourage excessive concentration, implementing delegation caps that limit how much any single validator can accumulate, and creating geographic and infrastructure diversity incentives that attract participants from new regions like India where blockchain infrastructure is rapidly growing.
Q10.10. Why do some blockchains claim to be decentralized but have a low Nakamoto Coefficient?
Many blockchain projects market themselves as decentralized based on their original design philosophy or the number of nodes in the network. However, the Nakamoto Coefficient cuts through marketing language by measuring the actual distribution of economic control rather than node count alone. A network with thousands of nodes but where a few validators control most of the stake still has a low Nakamoto Coefficient, revealing a concentration of power that the node count metric alone would obscure from view.
Explore Services
Related Services
Reviewed by

Aman Vaths
Founder of Nadcab Labs
Aman Vaths is the Founder & CTO of Nadcab Labs, a global digital engineering company delivering enterprise-grade solutions across AI, Web3, Blockchain, Big Data, Cloud, Cybersecurity, and Modern Application Development. With deep technical leadership and product innovation experience, Aman has positioned Nadcab Labs as one of the most advanced engineering companies driving the next era of intelligent, secure, and scalable software systems. Under his leadership, Nadcab Labs has built 2,000+ global projects across sectors including fintech, banking, healthcare, real estate, logistics, gaming, manufacturing, and next-generation DePIN networks. Aman’s strength lies in architecting high-performance systems, end-to-end platform engineering, and designing enterprise solutions that operate at global scale.