Ai Overview
On any given Monday morning in June 2026, you would expect global markets to be telling the same story. Tokyo and Seoul equity markets surged more than 5% overnight. And yet Bitcoin, the asset that its supporters have spent years calling “digital gold” and a “safe haven from geopolitical chaos,” sat there near $64,200, up less than 1% on the day, watching everything move around it. Until those boxes are checked, Bitcoin is holding its position near $64,000 — neither cracking nor convincingly breaking higher.
Key Takeaways
- Bitcoin is holding near $64,200 as of June 22, 2026, recovering from a dip below $63,000 seen earlier in the week after Iran briefly paused technical talks in Switzerland.
- The US-Iran diplomatic framework, mediated by Qatar and Pakistan, produced a 60-day memorandum of understanding — covering nuclear talks, sanctions, and Strait of Hormuz access — that has visibly eased geopolitical risk in global markets.
- Global equity markets reacted more aggressively than crypto: the S&P 500 closed up over 1%, the Nasdaq gained 1.91%, while Bitcoin’s response has been measured and cautious in comparison.
- Crypto traders remember that a prior US-Iran ceasefire headline in April 2026 sent Bitcoin from $65,000 to $78,000 — only for the deal to collapse and give back nearly all those gains. That failure is shaping today’s skepticism.
- Federal Reserve Chair Kevin Warsh held rates at 3.50–3.75% on June 17 but signaled a more restrictive path for 2026, which is weighing far more heavily on Bitcoin’s institutional demand than any peace-deal headline.
- Spot Bitcoin ETFs recorded five consecutive weeks of net outflows totaling nearly $1.8 billion before a single day of $85.85 million in net inflows on June 12 broke the streak — but one day does not confirm a reversal.
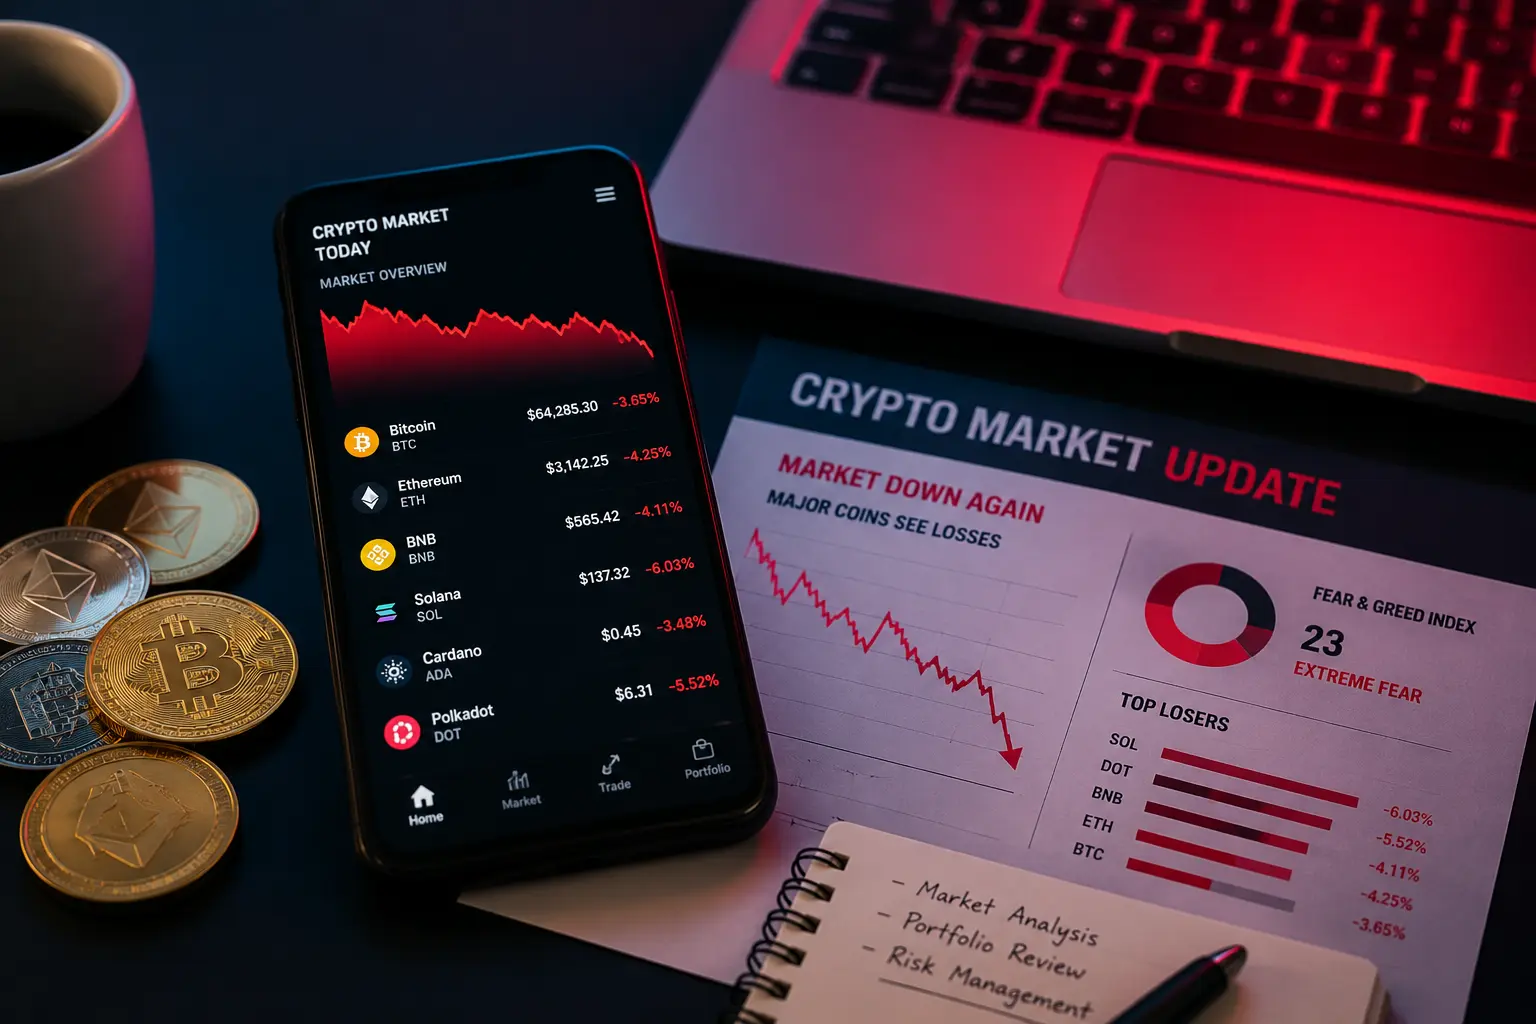
- The Crypto Fear and Greed Index sits near 23 — deep in Extreme Fear territory — reflecting how disconnected current market sentiment is from the improving geopolitical backdrop.
- Key technical levels to watch: $63,000–$64,000 as support and $66,000–$67,500 as the resistance zone that would need to crack for a genuine bullish move to develop.
- Analysts broadly agree: the real driver of Bitcoin’s next significant move will be Fed policy, ETF flows, and Treasury yield direction — not whether Iran and the US shake hands again this week.
- A sustained hold above $64,000 combined with renewed ETF inflows and softer inflation data could set the stage for Bitcoin to challenge $66,000 again — but the conditions are not yet confirmed.
A Market Telling Two Different Stories at Once
On any given Monday morning in June 2026, you would expect global markets to be telling the same story. When geopolitical risk eases when two countries locked in a tense standoff sit down in Switzerland and agree to a framework risk assets are supposed to rally together. Stocks go up. Oil goes down. Investors breathe out. That is exactly what happened when the US-Iran memorandum of understanding hit the wires in mid-June. Tokyo and Seoul equity markets surged more than 5% overnight. Brent crude dropped sharply. The S&P 500 closed with a clean 1% gain. And yet Bitcoin, the asset that its supporters have spent years calling “digital gold” and a “safe haven from geopolitical chaos,” sat there near $64,200, up less than 1% on the day, watching everything move around it.
That divergence is the most interesting thing happening in crypto markets right now. Not the peace deal itself but the fact that markets are treating it with genuine skepticism. Bitcoin traders who got burned by April’s false ceasefire are not piling back in just because diplomats are talking again. They want proof. They want the Strait of Hormuz actually open, ETF flows actually green, and the Fed actually not threatening to hike rates. Until those boxes are checked, Bitcoin is holding its position near $64,000 — neither cracking nor convincingly breaking higher.
What Happened in the Latest US-Iran Talks?
Switzerland, A Memorandum, and Why Financial Markets Care
The talks that have been moving markets these past few weeks started in earnest at Lake Lucerne in Switzerland. Pakistan and Qatar stepped in as mediators and helped broker what became a joint statement on June 22, 2026, describing “a positive and constructive atmosphere” and confirming that “encouraging progress has been made.” The statement specifically referenced the creation of a High-Level Committee — with dedicated working groups covering nuclear matters, sanctions, and dispute resolution — to continue overseeing the process. Pakistani Prime Minister Shehbaz Sharif had earlier said the two sides were “closer to a peace deal than ever before,” which gave markets their first meaningful de-escalation signal in weeks.
The deal that preceded this latest round of talks — signed in Switzerland around June 19 — was a 60-day memorandum of understanding covering Iran’s nuclear enrichment program, sanctions relief, the release of frozen Iranian funds, and renewed passage through the Strait of Hormuz. President Trump declared the agreement “complete” and announced the US would lift its naval blockade. Iran, for its part, suspended transit charges on commercial vessels through the Strait for the duration of the 60-day period. What markets are watching now is whether the technical phase of these talks actually proceeds on schedule — because when it paused briefly earlier this week, Bitcoin dropped below $63,000 immediately.[1]
Holding the $64k Zone But Not Without Effort
Bitcoin opened the week near $64,450 on June 18, but quickly slid to $63,980 by early morning as the Fed’s June 17 hawkish hold and news that Iran had briefly paused technical talks combined to pressure risk assets. From there, the price recovered and is sitting close to $64,200 as of Monday, June 22 — showing buyers are defending this zone with some conviction even if not with aggression. The weekly trend has been mostly flat: not the kind of breakout move that follows a genuine geopolitical resolution, but not the capitulation slide that would signal real panic either.
| Metric | Value | Context |
|---|---|---|
| Bitcoin Price | ~$64,200 | Holding above key $64,000 support zone |
| 24-Hour Change | ~+0.9% | Modest recovery; underperforming equities |
| Weekly Trend | Mostly flat | Range-bound between $63k and $65k |
| Recent Low | Below $63,000 | Tested when Iran paused Switzerland talks |
| Market Cap | ~$1.27 Trillion | Down from $1.3T+ seen earlier in June |
| Fear & Greed Index | 23 (Extreme Fear) | Macro stress, ETF outflows weighing on mood |
| 14-Day RSI | ~49.74 | Neutral — buyers have regained some control |
What is interesting about the current setup is that the RSI at 49.74 confirms what the price action suggests: buyers are not absent, but they are not excited either. The 4-hour RSI showing buyers back in control after the June dip is the most positive technical signal currently visible. The bigger concern is that Bitcoin’s 50-day moving average at $65,749.78 sits above the current price — acting as a ceiling rather than a floor — while the 200-day MA at $65,192.09 has been falling since late May. That is not a technical structure that encourages aggressive long entries.
Why Stocks Are Rallying but Crypto Is Not
Different Assets, Different Memory, Different Reaction Functions
Stock market investors are making a relatively clean trade. Lower geopolitical risk means lower energy costs, which feeds into lower inflation, which removes pressure from the Fed to hike rates further, which supports equity valuations. It is a chain of logic that equity desks run through quickly, and they moved. Crypto traders are running a different calculation — one weighted heavily by the April experience.
Why Traditional Markets Are Moving
- →Lower geopolitical risk directly boosts risk appetite in equity markets
- →Falling oil prices directly reduce input costs and inflation pressure
- →A better inflation outlook reduces the risk of additional Fed hikes
- →Stocks have institutional flows that respond mechanically to these signals
Why Crypto Is Staying Cautious
- →April’s ceasefire sent BTC from $65K to $78K — then collapsed, giving back most gains
- →ETF outflows have been persistent: $1.8B over five consecutive weeks before June 12
- →The Fed’s hawkish June 17 hold has more weight on BTC than any peace headline
- →Traders are explicitly waiting for stronger confirmation before adding exposure
As one analyst put it directly: “The real macro catalyst for Bitcoin this week is the Fed, not the ceasefire. Markets are focused on the updated dot plot and what it signals about the future path of rates.” That framing captures exactly why Bitcoin’s 2–3% response to a genuine diplomatic breakthrough looks muted — the asset’s market structure in June 2026 is being driven by liquidity and institutional flow dynamics that geopolitical headlines can shift temporarily but cannot fix structurally.
The Role of Oil Prices and the Strait of Hormuz
Why a Waterway in the Middle East Moves Bitcoin in North America
The Strait of Hormuz is roughly 33 kilometres wide at its narrowest point, sits between Iran and Oman, and carries somewhere around 20% of the world’s oil supply and a significant share of global liquefied natural gas shipments. When Iran threatened to restrict that traffic in response to US naval activity, energy markets freaked out — and they had every reason to. A sustained closure or even a partial disruption would push energy costs higher globally, forcing central banks to keep rates elevated longer to fight the resulting inflation. That is the transmission mechanism that connects a Persian Gulf waterway to Bitcoin’s price in real time.
The chain works like this: when oil prices spike because the Strait is threatened, inflation stays elevated, the Fed keeps rates high, borrowing costs stay expensive, institutions pull money from risky assets including Bitcoin, ETF inflows reverse, and price falls. When the Strait reopens and oil slides, that chain runs in reverse — but slowly, and only if the geopolitical resolution actually holds. The lower oil prints in mid-June were real. The question crypto markets are asking is whether they will persist, or whether another stalled negotiation round turns them back around.
Federal Reserve Policy Remains a Bigger Driver Than Geopolitics
Kevin Warsh, the Dot Plot, and What It Means for Bitcoin’s Liquidity
The Federal Reserve under new Chair Kevin Warsh held rates at 3.50–3.75% at its June 17 meeting — exactly as markets expected. But the way it held rates is what sent Bitcoin sliding that afternoon. Warsh’s statement signaled a more restrictive path for 2026: officials projected fewer rate cuts than markets had priced in, with some even raising the possibility of hikes if inflation data warranted. That is not a minor nuance. That is a direct statement that the liquidity environment which drove institutional money into Bitcoin through much of late 2025 and early 2026 is not returning anytime soon.
Bitcoin has dropped roughly 19% over the past month, and the explanation is straightforward: the Fed’s new leadership is running a rules-based, data-dependent policy in an environment where the ISM Prices Paid component hit 82.1 in May — a level that all but precludes rate cuts. The 30-year Treasury yield spent much of early June probing 5%, which makes US government bonds suddenly very competitive against Bitcoin as an asset class for institutional allocators. When a 30-year bond yields 5% with government backing, the case for holding volatile crypto at $64,000 gets harder to make inside an investment committee.
What Are Analysts Saying About Bitcoin Right Now?
Bullish, Bearish, and What Separates the Two Camps
Analyst opinion on Bitcoin at $64,000 right now is genuinely split — not because people disagree on the facts, but because they disagree on how much weight to assign to the improving macro backdrop versus the structural demand problem that ETF outflows represent. Here is where each camp sits.
The Case for Bitcoin Moving Higher from Here
Support at $64,000 has been tested multiple times this week and buyers keep showing up. The improving geopolitical backdrop — even if incomplete — genuinely reduces one of the major risk premiums that has been weighing on markets since tensions escalated in May. If oil stays soft, inflation data softens in July, and ETF inflows follow, the path to $66,000 opens relatively cleanly. Long-term analysts at CoinShares had projected a $110,000–$140,000 target for 2026 based on institutional adoption — that thesis has not changed, it is just delayed. The $85.85 million ETF inflow day on June 12 from IBIT and FBTC was the first positive institutional signal in weeks, and some analysts are treating it as an early reversal indicator.
- ✓Support holding near $64,000 with repeated buyer defense
- ✓Improving global risk sentiment on genuine diplomatic progress
- ✓Reduced geopolitical uncertainty removing a key risk premium
- ✓First ETF inflow day in weeks signals potential institutional re-engagement
The Case for Continued Caution
A ceasefire removes a risk premium, but it does not fix Bitcoin’s demand problem. Five consecutive weeks of ETF outflows totaling $1.8 billion represent a structural shift in institutional sentiment that one good diplomatic headline cannot reverse. The 30-day decline of roughly 15-19% from recent highs keeps the bearish technical structure intact until price reclaims the 50-day moving average at $65,749. Bitcoin’s dominance at 56.66% suggests altcoins are bleeding even more, indicating a risk-off posture across the entire crypto space. The real test is whether the June 12 ETF inflow was the start of something or a one-day anomaly — and the data does not yet tell you which it was.
- ✗Weak institutional demand — $1.8B in ETF outflows over five weeks
- ✗Failure to break $66,000 resistance despite positive macro backdrop
- ✗50-day MA at $65,749 sitting above price as active resistance
- ✗Fed not providing the liquidity tailwind that crypto needs to rally structurally
How Bitcoin Reacted to Previous US-Iran Developments
A Timeline That Explains the Current Caution
To understand why crypto traders are not jumping in right now, you need the full context of what this news cycle looked like from the beginning. The current cautious response is not irrational — it is the result of two previous false starts that cost traders real money
April 21, 2026 First Ceasefire Headline
An earlier truce announcement sent Bitcoin surging from roughly $65,000 to about $78,000 — a 15–20% spike in days. This was the “Iran ceasefire trade” in full force. But the deal collapsed. Price gave back nearly all those gains, and traders who bought the headline at $75,000+ were badly underwater within weeks. This failure is now the primary reference frame every crypto desk is applying to June’s moves
Early June 2026 Talks Collapse Again, Bitcoin Hits $69K and Falls
When Iran suspended US ceasefire talks in early June after Israeli strikes in Lebanon, Bitcoin slid from near $74,000 (its May 28 high) to $69,476 and kept falling. Spot ETF outflows hit a record $1.44 billion in a single week. The Fear and Greed Index crashed to 12 Extreme Fear. The ISM Prices Paid print of 82.1 in the same week confirmed that energy-driven inflation was very much alive, and the Fed was in no position to help.
Mid-June 2026 Peace Framework Lifts Markets, Bitcoin Briefly Hits $66K–$67K
The June 14-15 peace framework announcement drove Bitcoin to $66,552–$66,683 — up around 3.78–4.3% in 24 hours. It was the strongest pop in weeks. But the move was telling in its size: a genuine Middle East peace deal produced less than a 5% crypto rally, compared to the 15–20% seen in April before the deal collapsed. The market was clearly pricing magnitude against probability — acknowledging the positive but discounting heavily for the chance it falls apart again.
June 22, 2026 Stabilizing Near $64,200, Waiting for Confirmation
Bitcoin has settled back below the $65,000–$66,000 range after the initial ceasefire surge and the subsequent volatility from Iran briefly pausing technical talks. The asset is holding at $64,200 a level that buyers are defending but where no one is in a hurry to add new risk. The next catalyst has to be something structural: sustained ETF inflows, a softer inflation print, or a confirmed second Strait of Hormuz passage without incident.
Technical Analysis Important Bitcoin Levels to Watch
Support, Resistance, and What Each Level Means for the Next Move
The technical picture in Bitcoin right now is genuinely mixed not cleanly bearish, not convincingly bullish. The 4-hour RSI recovering to near 59 after the June dip means buyers have retaken short-term momentum. But with the 50-day MA sitting above the price at $65,749 and the MACD negative, the medium-term technical structure is still telling a cautionary story. Here is how to read the key levels:
| Level | Price | Significance | Status |
|---|---|---|---|
| Support 1 | $64,000 | Primary support buyers are actively defending this week | Holding |
| Support 2 | $63,000 | Second support tested when Iran paused talks; held with limited bounce | Watch |
| Danger Zone | Below $62,000 | A break here risks a deeper move toward $60,000 with limited structural support | Danger |
| Resistance 1 | $66,000 | Ceiling tested during peak ceasefire optimism; needs to break cleanly | Resistance |
| Resistance 2 | $67,500 | Reclaiming this would signal a genuine trend change; currently far from reach | Far |
| 50-Day MA | $65,749 | Sitting above current price — acting as ceiling rather than floor | Resistance |
If $64,000 support breaks with conviction particularly on a bad inflation print or another pause in Iran-US talks — the next stop is likely $62,000 or below. That would represent a meaningful loss of confidence and could trigger another round of ETF redemptions. On the upside, a clean break and close above $66,000 on strong volume would be the first genuine technical signal that the medium-term bearish structure is shifting. Until then, this is consolidation — and patient traders are watching, not acting.
Outlook Can Bitcoin Move Above $66,000 Again?
What Would Actually Need to Happen for a Genuine Breakout
Bitcoin breaking and sustaining above $66,000 is entirely possible — but it requires a specific combination of events, not just one. Analysts who have covered this market through 2025 and into 2026 are consistent on the conditions: the diplomatic progress needs to actually translate into physical reality at the Strait of Hormuz, inflation data needs to show the energy price relief flowing through to core CPI, the Fed’s tone needs to soften even slightly, and ETF inflows need to recover from one good day into a sustained trend.
The encouraging part is that the structural long-term thesis for Bitcoin has not changed. CoinShares’ projection of $110,000–$140,000 for 2026 was built on institutional ETF demand accelerating through the year — and that acceleration stalled during the Middle East escalation and Fed hawkishness, but has not been permanently dismantled. The question of timing matters enormously. If July’s CPI print shows inflation falling and the technical talks in Switzerland proceed on schedule and produce concrete progress on Hormuz reopening, the setup for a move through $66,000 builds quickly.
Stability Near $64,000 Is Not the Same as Safety
Bitcoin sitting at $64,200 with the world’s most consequential diplomatic talks advancing in Switzerland is a strange kind of market moment. Everything around crypto is improving — oil prices are softer, geopolitical temperature has come down, stocks are rallying. And yet Bitcoin is holding its ground rather than breaking higher, because the people who manage institutional Bitcoin money remember April. They remember the 15–20% surge that evaporated when that ceasefire collapsed. They have seen this movie. They are not buying the sequel until the third act actually holds.
That caution is rational. The Federal Reserve’s hawkish hold on June 17 carries more weight for Bitcoin’s next significant move than any peace deal headline, because it determines the liquidity environment that institutional ETF flows respond to. Five weeks of net outflows do not reverse on one good diplomatic day. They reverse when the Fed signals it is done tightening, when inflation data confirms energy prices are staying down, and when ETF flows show institutional buyers actually re-engaging not just pausing their exit. Until those conditions materialize together, $64,000 is where Bitcoin lives. It is not comfortable, but it is not collapsing either.
Frequently Asked Questions
Q1.Why is Bitcoin trading near $64,000?
Bitcoin is trading near $64,000 as investors balance improving geopolitical sentiment from US-Iran talks with ongoing concerns about interest rates, inflation, and overall market uncertainty.
Q2.How do US-Iran talks affect Bitcoin prices?
US-Iran negotiations can influence global risk sentiment, oil prices, and investor confidence, all of which may indirectly impact Bitcoin and other cryptocurrencies.
Q3.Why didn't Bitcoin rally along with stock markets?
While stocks benefited from reduced geopolitical tensions, crypto investors remained cautious and focused on broader factors such as Federal Reserve policy, ETF flows, and market liquidity.
Q4.What role does the Strait of Hormuz play in financial markets?
The Strait of Hormuz is one of the world’s most important oil shipping routes. Any disruption can affect oil prices, inflation expectations, and investor sentiment across global markets.
Q5.Is Bitcoin considered a safe-haven asset during geopolitical tensions?
Bitcoin is sometimes viewed as a hedge against uncertainty, but its behavior during geopolitical events can vary depending on market conditions and investor sentiment.
Q6.What are the key support and resistance levels for Bitcoin?
Analysts are closely watching support near $63,000–$64,000 and resistance around $66,000–$67,500 to determine Bitcoin’s next major price movement.
Q7.How do oil prices impact Bitcoin?
Changes in oil prices can influence inflation expectations and central bank policies, which may affect demand for risk assets such as Bitcoin.
Q8.What factors could push Bitcoin above $66,000?
Positive macroeconomic data, strong institutional demand, increased ETF inflows, and continued improvement in global risk sentiment could help Bitcoin move above $66,000.
Q9.What risks could cause Bitcoin to fall below $64,000?
Renewed geopolitical tensions, higher-than-expected inflation, Federal Reserve rate hikes, or significant crypto market sell-offs could put downward pressure on Bitcoin.
Q10.What should investors watch in the coming weeks?
Investors should monitor US-Iran negotiations, Federal Reserve policy decisions, inflation reports, Bitcoin ETF activity, and broader market sentiment for clues about Bitcoin’s next direction.
Explore Services
Related Services
Reviewed by

Naman Singh
Co-Founder & CEO, Nadcab Labs
Naman Singh is the Co-Founder and CEO of Nadcab Labs, where he drives the company’s vision, global growth, and strategic expansion in blockchain, fintech, and digital transformation. A serial entrepreneur, Naman brings deep hands-on experience in building, scaling, and commercializing technology-driven businesses. At Nadcab Labs, Naman works closely with enterprises, governments, and startups to design and implement secure, scalable, and business-ready Web3 and blockchain solutions. He specializes in transforming complex ideas into high-impact digital products aligned with real business objectives. Naman has led the development of end-to-end blockchain ecosystems, including token creation, smart contracts, DeFi and NFT platforms, payment infrastructures, and decentralized applications. His expertise extends to tokenomics design, regulatory alignment, compliance strategy, and go-to-market planning—helping projects become investor-ready and built for long-term sustainability. With a strong focus on real-world adoption, Naman believes in building blockchain solutions that deliver measurable value, solve practical problems, and unlock new growth opportunities for organizations worldwide.