Ai Overview
Decentralized finance has evolved from experimental protocols into a robust alternative financial infrastructure. The DeFi market size now exceeds $237 billion in total value locked as of Q3 2025. DeFi emerged from near-zero value in 2018 to reach over $180 billion at its 2021 peak. The Terra/LUNA collapse in May 2022 triggered a 70% drawdown that shook investor confidence.
Key Takeaways
- DeFi market size reached record $237 billion TVL in Q3 2025
- Institutional TVL climbed to $42 billion, representing 11.5% of total
- Asia-Pacific leads growth at 19.50% CAGR through 2030
- Market projections range from $78 billion to $1.4 trillion by 2030-2033
- Security risks and regulatory uncertainty remain key challenges
Introduction to the DeFi Market
Decentralized finance has evolved from experimental protocols into a robust alternative financial infrastructure. The DeFi market size now exceeds $237 billion in total value locked as of Q3 2025.
Millions of users rely on DeFi platforms for lending, trading, saving, and yield generation. This guide examines the current state, growth drivers, and future trajectory of this transformative sector.
- $237 billion — Record TVL reached in Q3 2025
- 14.2 million — Unique wallets interacting with DeFi protocols
- 41% — Year-over-year TVL growth
- 110+ countries — Report active DeFi usage
What Is the DeFi Market?
DeFi refers to financial services built on decentralized blockchain networks without traditional intermediaries. Smart contracts automate lending, trading, and asset management functions previously controlled by banks.
The ecosystem operates 24/7 across global networks. Users retain custody of assets while accessing sophisticated financial instruments.
Ethereum hosts the majority of DeFi activity with 63% of all protocols. Alternative chains like Solana, BNB Chain, and Layer-2 networks capture growing market share.
- Decentralized Exchanges (DEXs) — Peer-to-peer trading without centralized order books
- Lending Protocols — Algorithmic borrowing and lending with collateralized positions
- Liquid Staking — Earning yield while maintaining asset liquidity
- Yield Aggregators — Automated strategies to maximize returns
- Stablecoins — Dollar-pegged tokens enabling low-volatility transactions
- Derivatives — On-chain futures, options, and synthetic assets
Over 2,000 dApps now incorporate DeFi modules for lending, staking, or trading. The sector processes millions of transactions daily with less than 0.3% error rate.
Current DeFi Market Size Overview
The DeFi market size varies depending on measurement methodology. TVL represents assets deposited in protocols, while market capitalization tracks token valuations.
Industry analysts provide different estimates based on scope and data sources. Understanding these distinctions helps investors assess the true scale of the ecosystem.
- $237 billion TVL — DappRadar Q3 2025 report (record high)
- $98.4 billion — Top 100 DeFi token market cap (Q2 2025)
- $51.22 billion — Market revenue valuation (Mordor Intelligence 2025)
- $86.53 billion — Technology market size (Fortune Business Insights 2025)
- $26.94 billion — Revenue estimation (Grand View Research 2025)
Ethereum commands 49% of total DeFi TVL with $119 billion locked. Despite a 4% quarterly decline, it maintains clear market leadership.
Alternative chains capture growing market share. Arbitrum holds $10.4 billion (8.4% of TVL), while Solana maintains $8-9 billion with 81% of global DEX trade volume.
Over 150 protocols individually hold more than $100 million in locked assets. This distribution indicates maturing infrastructure beyond early dominant players.
The top 4 DeFi protocols contribute over 50% of total TVL. Lido leads with $34.8 billion, followed by Aave at $20.38 billion. This concentration creates both stability and systemic risk considerations.
Historical Growth of the DeFi Market
DeFi emerged from near-zero value in 2018 to reach over $180 billion at its 2021 peak. The Terra/LUNA collapse in May 2022 triggered a 70% drawdown that shook investor confidence.
Recovery began in late 2023 as institutional interest returned alongside broader crypto market improvement. The approval of Bitcoin ETFs in early 2024 accelerated capital inflows.
- 2018: DeFi TVL under $1 billion — Early experiments with MakerDAO
- 2020: “DeFi Summer” — TVL surges past $15 billion with yield farming boom
- 2021: Peak TVL exceeds $180 billion during bull market
- 2022: Market crash — TVL drops below $50 billion after Terra collapse
- 2023: Stabilization phase — TVL hovers around $40-50 billion
- 2024: Recovery phase — Institutional TVL hits $42 billion
- 2025: Record high — $237 billion TVL achieved in Q3
The market has seen 2100% revenue growth since 2021. This trajectory reflects maturing infrastructure and expanding use cases beyond speculative trading.
Protocol diversity increased significantly during the recovery period. New categories like liquid staking and restaking emerged as major TVL drivers.
The 2022 crash provided valuable lessons. Protocols improved risk management, reduced leverage exposure, and enhanced smart contract security. These improvements contributed to the stronger 2025 rally.
Key Drivers of DeFi Market Growth
Multiple factors accelerate DeFi adoption across retail and institutional segments. Technological improvements and regulatory clarity lead the expansion.
Infrastructure upgrades have dramatically reduced costs and improved user experience. Layer-2 rollups processed over $42 billion in value during Q1 2025 alone.
- Layer-2 Scaling: 30% reduction in transaction costs via rollups
- Regulatory Clarity: EU MiCA framework and US stablecoin legislation
- Institutional Adoption: $42 billion institutional TVL in 2024
- Real-World Assets: Tokenized treasuries and credit products
- Mobile Access: 45% growth in mobile DeFi wallet usage
- Stablecoin Expansion: 78% year-over-year growth in USDC float
- Financial Inclusion: Access for 1.7 billion unbanked globally
Mastercard’s partnership with Chainlink grants 3.5 billion cardholders indirect access to DeFi liquidity. Circle’s NYSE listing in June 2025 validated the stablecoin model.
First-time DeFi user onboarding increased by 29% as platforms offered gasless transactions and simplified interfaces. Gen Z users (ages 18-25) now comprise 38% of first-time wallets.
Role of Total Value Locked in DeFi Market Size
TVL measures capital deposited across DeFi protocols. It serves as the primary metric for assessing DeFi market size and protocol health.
Higher TVL indicates greater user trust and protocol utility. However, TVL should be analyzed alongside other metrics like active users and transaction volume.
- Lido Finance: $34.8 billion TVL — Liquid staking leader
- Aave: $20.38 billion TVL — Top lending protocol
- Uniswap: $12.3 billion market cap — DEX dominance
- EigenLayer: $6.3 billion — Restaking innovation
- Compound: Part of top 4 protocols controlling 50%+ of TVL
- MakerDAO: Foundational protocol for DAI stablecoin
Liquid staking represents 27% of total TVL, making it the largest DeFi category. Lending protocols hold $51 billion in outstanding loans as of June 2025.
Average daily TVL volatility dropped to 1.4% in 2025, indicating improved ecosystem stability. This reduced volatility attracts institutional capital seeking predictable operations.
Blockchain-specific TVL distribution shows clear patterns. Ethereum hosts 77% of all TVL in DeFi lending platform protocols. Solana and Polygon account for a combined $9.6 billion driven by low fees.
BNB Chain maintains $7.9 billion in TVL across 310+ dApps. Base, Coinbase’s Layer-2, reached $2.2 billion and became a hub for institutional DeFi activity.
DeFi Market Growth by Sector
Different DeFi verticals exhibit varying growth rates and market shares. DEXs and lending dominate current volume while newer sectors emerge.
Sector performance reflects both technological maturity and user demand patterns. Understanding these dynamics helps identify opportunities.
- DEXs: 32.45% market share — Solana processes 81% of global DEX trades
- Lending: 43% of TVL — $51.2 billion in outstanding loans
- Liquid Staking: 27% of TVL — Fastest-growing segment
- RWA Tokenization: 9.55% projected CAGR through 2030
- Cross-border Settlement: 10.65% CAGR to 2030
- Derivatives: Growing institutional demand for on-chain options
- Insurance: 21st largest segment, significant growth potential
Stablecoins form 62% of all collateral in DeFi lending platforms. USDC and DAI dominate institutional deployments.
Auto-compounding vaults like Yearn’s yVaults saw $5.1 billion in deposits. Staked stablecoin pools reached $11.7 billion as users sought bear market protection.
Regional Adoption Trends in the DeFi Market
DeFi adoption varies significantly across global regions. North America leads in market share while Asia-Pacific shows fastest growth.
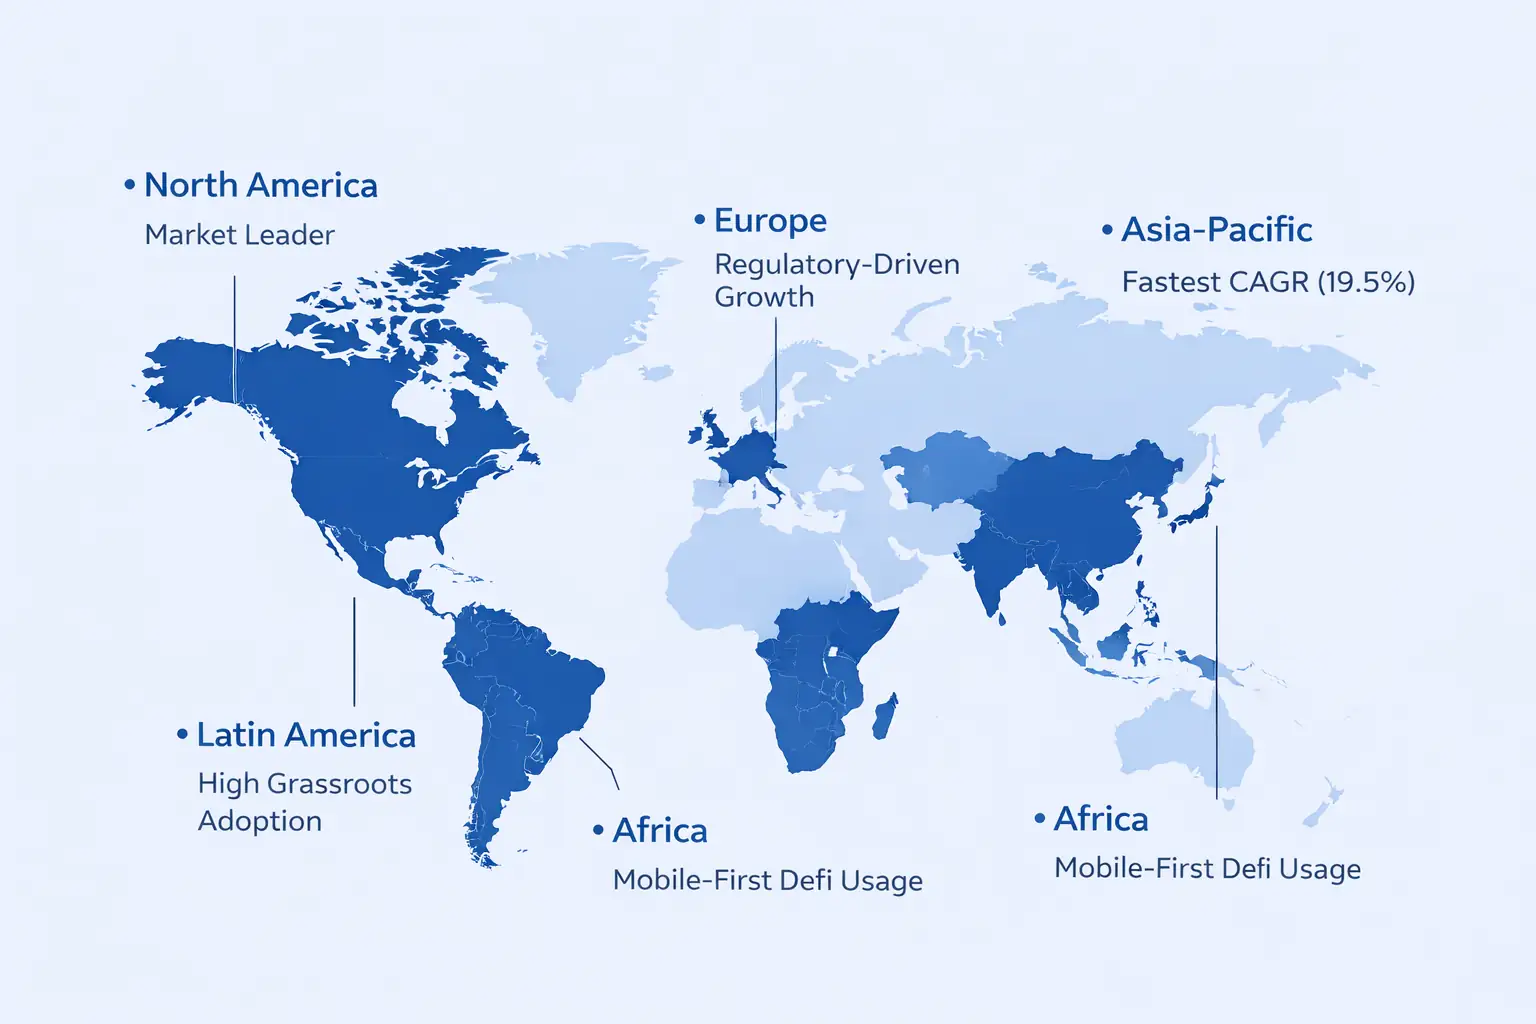
Regional differences reflect regulatory environments, infrastructure quality, and financial inclusion needs. Understanding these patterns helps identify growth opportunities.
- North America: 36.5% market share — US leads with $2.5 billion revenue
- Europe: 29% share — MiCA framework driving institutional adoption
- Asia-Pacific: 23% share — 19.50% CAGR, fastest-growing region
- Latin America: 8% share — 63% YoY growth in transaction volume
- Middle East & Africa: 3% share — UAE implementing structured framework
India and Vietnam lead grassroots adoption with strong mobile-first user bases. Asia-Pacific crypto volume grew 69% YoY to $2.36 trillion.
33% of DeFi users are based in Asia, with Vietnam, India, and the Philippines among top adopters. 21% of adoption comes from Latin America where Brazil and Argentina lead.
Sub-Saharan Africa represents 19% of active DeFi users, particularly Nigeria and Kenya where mobile finance dominates. Only 14% of global DeFi adoption occurs in North America and Europe despite hosting 47% of banked individuals.
DeFi Market Compared to Traditional Finance
DeFi offers distinct advantages and limitations versus traditional banking systems. The comparison reveals complementary strengths rather than direct competition.
Understanding these differences helps investors and institutions evaluate where DeFi adds value to existing financial infrastructure.
| Metric | DeFi | Traditional Finance |
|---|---|---|
| Transaction Speed | 3.6 seconds average | 28 hours (international wire) |
| Operating Hours | 24/7/365 | Business hours only |
| Lending Rates | 4-12% APY typical | 0.5-2% savings rate |
| Access Requirements | Wallet only | ID, credit history, account |
| Transparency | Full on-chain visibility | Limited disclosure |
| Insurance | Limited protocol coverage | FDIC/government backing |
| Error Rate | Less than 0.3% | 2-5% processing errors |
| Global Reach | 110+ countries | Limited by banking presence |
DeFi saved $1.2 billion globally in remittance fees in 2025. Traditional banks still dominate volume but face efficiency challenges in cross-border operations.
93% of DeFi smart contract deployments are automated with no human intervention post-launch. This contrasts with traditional finance requiring extensive manual processing.
78% of traditional banking institutions still require in-person identity verification in emerging markets. DeFi provides access to 1.7 billion unbanked individuals globally.
The boundaries between DeFi and traditional finance continue blurring. 19% of DeFi platforms have partnered with traditional banks for fiat on-ramps and off-ramps.
Impact of Institutional Adoption on DeFi Growth
Institutional capital increasingly flows into DeFi through regulated channels. This shift transforms protocol sustainability and market dynamics.
Banks and asset managers now integrate on-chain protocols into cash-management workflows. Corporate treasury operations route through DeFi rails for 24/7 liquidity access.
- $42 billion — Institutional TVL in 2024
- 11.5% — Institutional share of total DeFi TVL
- $12.5 billion — Stablecoin holdings by institutions
- 16.2% — Rise in institutional DeFi trading activity
- 71% — Asia-based institutions consider tokenized assets viable
- 19% — DeFi platforms partnered with traditional banks
- 46% — Leading platforms offer custodial wallets for institutions
Permissioned pools like Aave Arc enable KYC-verified institutional lending. J.P. Morgan’s Onyx platform integrates DeFi protocols into treasury operations.
Tokenized private credit platforms such as Maple Finance and Centrifuge offer yields of 9-12% with senior and junior tranches. Banking API integrations rose 29% in 2025.
Hybrid DeFi/CeFi platforms grew 24% as users sought regulated access with decentralized flexibility. Visa and Mastercard integrations expanded 34% for card-linked DeFi funding.
Challenges Slowing DeFi Market Expansion
Several obstacles constrain broader DeFi adoption despite technological advances. Security and complexity remain primary concerns for users and institutions.
Understanding these barriers helps identify improvement opportunities and realistic growth expectations.
- Security Risks: $434 million stolen in Q3 2025 alone
- User Complexity: Technical barriers limit mainstream adoption
- Retail Exit: 22.4% decline in daily active wallets (Q3 2025)
- Liquidity Fragmentation: Capital spread across 150+ protocols
- Legal Uncertainty: Smart contract enforceability unclear in most jurisdictions
- Scalability Limits: Network congestion during high-demand periods
- Collateral Volatility: Crypto assets as collateral create liquidation risks
DAO security budgets grew 32% in 2025 to address vulnerabilities. Protocol audits and insurance products are expanding coverage.
DeFi lacks traditional protection mechanisms like deposit insurance or complaint channels. Market manipulation and insider trading occur without regulatory oversight.
The absence of unified global regulations creates challenges for cross-border operations. Companies face unpredictable legal environments that make long-term planning difficult.
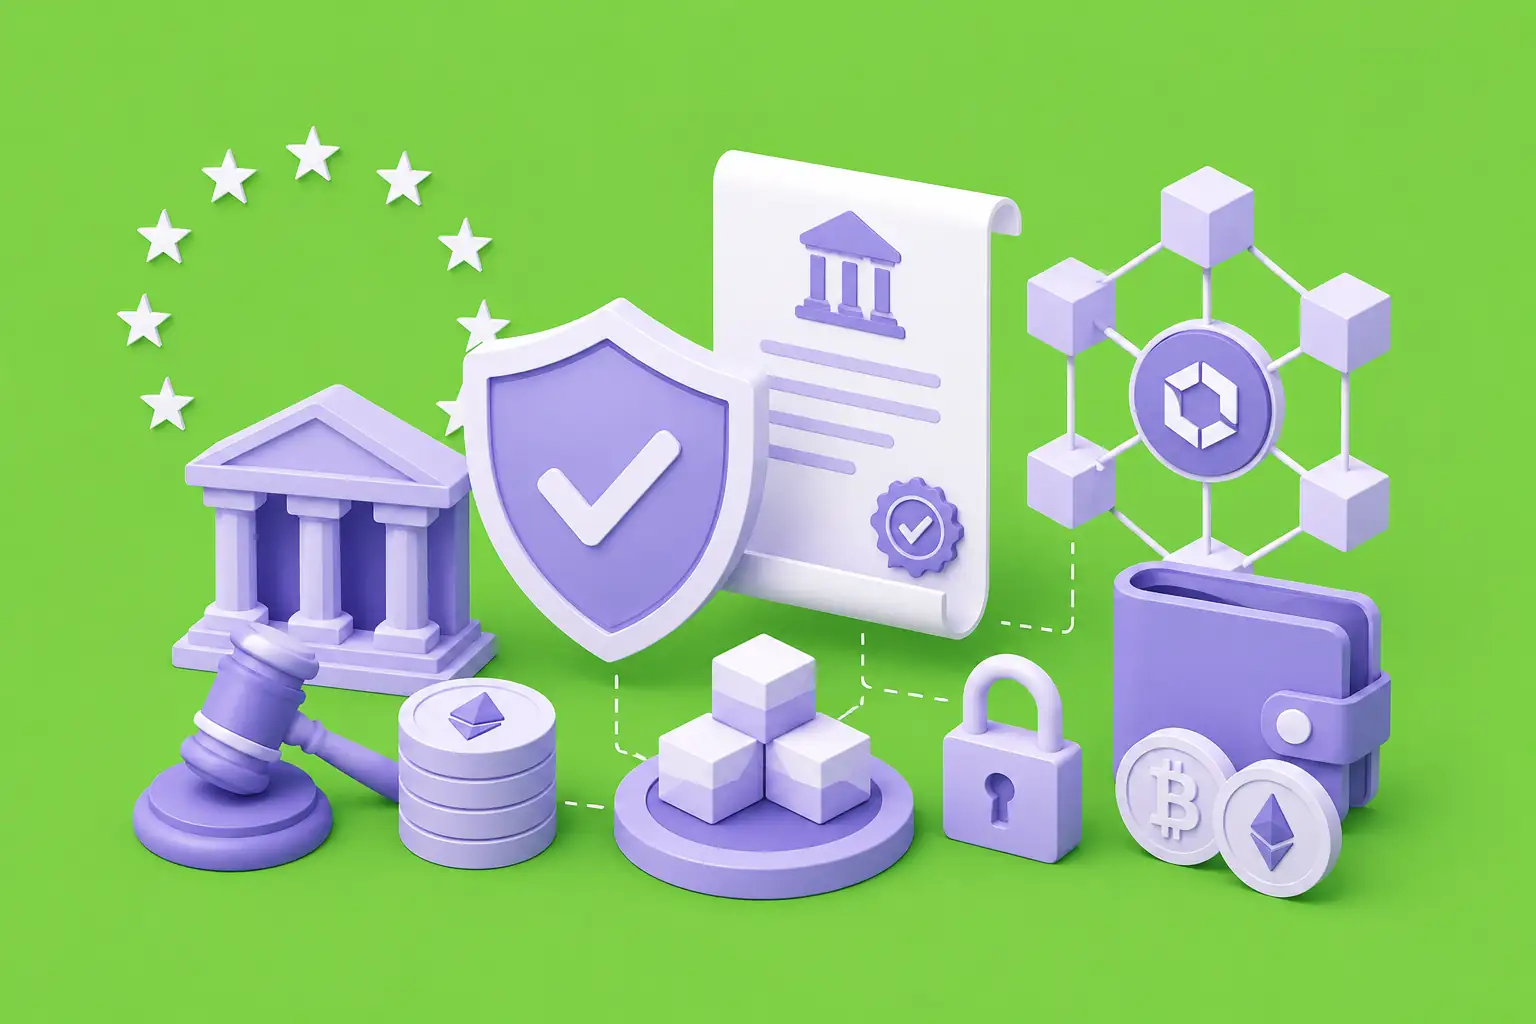
Regulatory Influence on DeFi Market Growth
Regulatory frameworks increasingly shape DeFi market development. Clear rules attract institutional capital while ambiguity constrains growth.
The regulatory landscape evolved significantly in 2024-2025. Major jurisdictions moved from observation to active rulemaking, creating both opportunities and compliance requirements.
- EU MiCA: Unified framework effective 2025 — Licensing required for service providers
- US GENIUS Act: Bipartisan stablecoin legislation progressing through Congress
- Hong Kong: Comprehensive licensing for stablecoin activities and exchanges
- Singapore: Project Guardian testing asset tokenization with major banks
- UAE: VARA implementing structured virtual asset framework in Dubai
- Saudi Arabia: Blockchain pilots under Vision 2030 with regulatory sandboxes
43 countries have established DeFi regulatory sandboxes or frameworks in 2025. 31% of global DeFi volume comes from jurisdictions with clear DAO recognition.
France granted Circle an e-money license, enabling global USDC issuance inside a regulated framework. This boosted stablecoin float by 78% year-over-year.
The SEC continues scrutinizing decentralized exchange order-flow transparency. However, policymakers are trending toward tailored rulemaking rather than outright prohibition.
$2.5 billion in DeFi platform revenue was subject to compliance-based disclosures in 2025. This transparency requirement signals maturing relationships between protocols and regulators.
European Central Bank and US Federal Reserve initiated drafting of guidelines for regulated DeFi applications. These institutions are actively researching how banks can safely participate in decentralized protocols.
DeFi Market Size During Market Cycles
DeFi market size correlates strongly with broader crypto market cycles. Bull markets amplify TVL while bear markets test protocol resilience and sustainability.
Understanding cyclical patterns helps investors time allocations and manage expectations during different market phases.
- 2021 Peak: TVL exceeded $180 billion during crypto bull run
- 2022 Crash: Terra collapse triggered 70% TVL decline in weeks
- 2023 Bottom: TVL stabilized near $40 billion after capitulation
- 2024 Recovery: Bitcoin ETF approval sparked renewed institutional interest
- 2025 Record: $237 billion TVL surpasses previous all-time highs
Average daily TVL volatility dropped to 1.4% in 2025. This indicates improved ecosystem stability compared to earlier cycles with 5-10% daily swings.
Protocol revenue sources shifted during the bear market. Sustainable fee income from actual transaction demand replaced token emission subsidies.
The current cycle shows different characteristics than 2021. Institutional participation is higher, speculative leverage is lower, and real-world asset integration provides stability.
Staked stablecoin pools reached $11.7 billion as users adopted bear market protection strategies. These defensive positions contributed to TVL stability during volatile periods.
Future Projections for the DeFi Market
Analysts project substantial DeFi market growth through 2030 and beyond. Estimates vary based on methodology and scope of measurement.
Conservative projections focus on current protocol revenue while aggressive forecasts assume broader institutional adoption and new use cases.
- Mordor Intelligence: $78.49 billion by 2030 (8.96% CAGR)[1]
- Fortune Business Insights: $457.35 billion by 2032 (26.9% CAGR)
- Grand View Research: $231.19 billion by 2030 (53.7% CAGR)
- Grand View (Extended): $1.42 trillion by 2033 (68.2% CAGR)
- Research and Markets: $351.75 billion by 2031 (48.9% CAGR)
- Next Move Strategy: $390.47 billion by 2030 (54.2% CAGR)
User count is expected to reach 213 million by 2026. Penetration rate projected to increase from 2.38% to 2.71%.
The payments segment is expected to register fastest growth as merchant adoption and blockchain-based remittances expand. Smart contracts segment shows significant CAGR potential as more centralized platforms decentralize.
Gaming applications are projected to grow with the highest CAGR by application type. This reflects convergence of DeFi with Web3 gaming economies and virtual asset markets.
Emerging Trends Shaping DeFi Growth
Several technological and market trends are reshaping the DeFi landscape. These developments will define the next growth phase.
Innovation continues across protocol design, user experience, and institutional integration. The sector shows strong adaptability to market demands.
- RWA Tokenization: $670 million in tokenized assets including real estate and bonds
- Restaking: EigenLayer attracted $6.3 billion in deposits
- AI Integration: Gauntlet AI and FetchFi surpassed $850 million usage
- Account Abstraction: Gasless transactions via ERC-4337 standard
- Cross-Chain Activity: 52% growth driven by bridges and L2 expansion
- DeFi ETFs: $540 million raised in Switzerland and Singapore (Q1 2025)
- DePIN Integration: $1.1 billion in physical infrastructure liquidity pools
- Modular Architecture: Celestia and Avail supporting data availability layers
Layer-2 networks like Arbitrum ($10.4 billion TVL) and Optimism ($5.6 billion TVL) saw 85% user growth in 2025. Base reached $2.2 billion as a hub for institutional activity.
Telegram bots for DeFi trading gained traction with 45% mobile wallet usage growth. Simplified UX targets mainstream adoption beyond crypto-native users.
The Bank for International Settlements experiments with DeFi protocols for wholesale CBDC applications. Settlement times could reduce from days to minutes.
Investment Opportunities in the DeFi Market
DeFi offers multiple investment avenues for different risk profiles. Understanding options helps optimize portfolio allocation and manage exposure.
Institutional investors increasingly access DeFi through regulated vehicles. Retail participants benefit from direct protocol interaction with lower barriers to entry.
- Liquid Staking: 4-7% yields on ETH and SOL staking via Lido
- Lending Protocols: Stablecoin yields of 5-12% APY on Aave and Compound
- DEX Liquidity: Fee revenue from providing trading pairs on Uniswap
- Governance Tokens: UNI, AAVE, LDO offering protocol ownership
- DeFi ETFs: Regulated exposure through traditional markets
- RWA Protocols: Tokenized treasury yields of 4-5%
- Restaking: Additional yield via EigenLayer on staked assets
- Yield Aggregators: Automated optimization through Yearn vaults
94% of profitable DeFi users maintain portfolios between $5,000 and $100,000. Average user deposits reached $2,800 in 2025, indicating broader participation.
Treasury allocation to DeFi among publicly listed blockchain companies averaged 11.3%. This corporate adoption validates long-term investment theses.
Tokenized private credit platforms offer yields of 9-12% with senior and junior tranches. These products attract sophisticated investors seeking higher risk-adjusted returns.
Bitcoin yield products enable institutions to earn interest by lending holdings or using them as collateral. This represents a lower-risk entry point than native DeFi protocols.
MetaMask has exceeded 100 million total users and maintains 30 million+ monthly active users. This wallet infrastructure provides essential access to DeFi investment opportunities.
Risks to Consider in DeFi Market Growth
DeFi investments carry significant risks that require careful management. Understanding these factors is essential for informed participation.
Risk profiles vary significantly across protocol types and strategies. Conservative approaches like stablecoin lending differ dramatically from leveraged yield farming.
- Smart Contract Risk: Code vulnerabilities can lead to complete fund loss
- Market Volatility: Collateral liquidation during rapid price crashes
- Regulatory Risk: Changing rules may restrict operations or freeze assets
- Impermanent Loss: Liquidity providers may underperform simple holding
- Oracle Manipulation: Price feed attacks can drain protocol treasuries
- Rug Pulls: $2 billion lost to project abandonment in 2022 alone
- Bridge Exploits: Cross-chain bridges remain high-value attack targets
- Governance Attacks: Token accumulation can enable malicious proposals
Over 90% of DeFi protocols rely on Chainlink oracles for secure price feeds. This concentration creates systemic dependency on oracle infrastructure.
Protocol audits and insurance products help mitigate risks but cannot eliminate them. Coverage remains limited relative to total TVL exposure.
The Mango Markets incident in 2023 resulted in $114 million losses due to price manipulation. Such events highlight ongoing market manipulation vulnerabilities.
DeFi loans rely on crypto assets as collateral, which can experience significant value declines during market downturns. Liquidation cascades can amplify price crashes.
Only 4% of smaller protocols face data recency issues in 2025, down from higher rates in previous years. However, information asymmetries persist in newer protocols.
Closure on DeFi Market Size and Growth
The DeFi market has matured from experimental protocols into a $237 billion ecosystem. Institutional adoption, regulatory clarity, and technological improvements drive continued expansion.
Market projections suggest growth to $231-457 billion by 2030, depending on assumptions. The sector faces challenges including security risks and user complexity.
- Current State: $237 billion TVL with 14.2 million active wallets
- Growth Rate: 41% YoY TVL increase in 2025
- Future Outlook: Projections range from $78-457 billion by 2030-2032
- Key Catalyst: Institutional capital and regulatory frameworks
DeFi is no longer a fringe experiment. It represents a parallel financial infrastructure reshaping global finance.
The future of DeFi depends on continued security improvements, regulatory adaptation, and mainstream accessibility. Investors and founders should monitor these developments closely.
FAQs: DeFi Market
Q1.Is DeFi legal to use in most countries?
DeFi itself is not illegal in most regions, but regulations vary by country. Users are generally responsible for complying with local tax and financial laws when interacting with DeFi platforms.
Q2.How can beginners start using DeFi safely?
Beginners should start with well-known protocols, use audited platforms, avoid high-leverage strategies, and begin with small amounts to understand risks before scaling up.
Q3.Do DeFi platforms require KYC verification?
Most decentralized protocols do not require KYC, but some institutional or permissioned DeFi platforms may enforce identity checks to meet regulatory requirements.
Q4.What wallet is best for accessing DeFi applications?
Non-custodial wallets like MetaMask, Trust Wallet, and hardware wallets such as Ledger are commonly used for interacting with DeFi platforms securely.
Q5.How much money is needed to participate in DeFi?
There is no fixed minimum. Users can start with as little as $10–$50 on low-fee networks, although transaction costs and strategy choice can affect feasibility.
Q6.How are DeFi earnings taxed?
In most jurisdictions, DeFi earnings such as interest, staking rewards, or trading profits are taxable. Tax treatment depends on local laws and transaction type.
Q7.What happens if a DeFi protocol shuts down?
If smart contracts remain active, funds may still be accessible. However, abandoned interfaces or governance failures can make recovery difficult, highlighting the importance of protocol credibility.
Q8.How do users calculate real APY in DeFi?
Real APY depends on token price changes, compounding frequency, fees, and incentives. Dashboard estimates may differ from actual returns over time.
Q9.Can DeFi be used without owning cryptocurrency?
Most DeFi platforms require crypto assets to pay gas fees or provide liquidity, but fiat on-ramps and card integrations are gradually reducing this barrier.
Q10.How can users identify DeFi scams or risky projects?
Red flags include anonymous teams, unaudited contracts, unrealistic returns, aggressive marketing, and locked liquidity controlled by a single wallet.
Explore Services
Related Services
Reviewed by

Aman Vaths
Founder of Nadcab Labs
Aman Vaths is the Founder & CTO of Nadcab Labs, a global digital engineering company delivering enterprise-grade solutions across AI, Web3, Blockchain, Big Data, Cloud, Cybersecurity, and Modern Application Development. With deep technical leadership and product innovation experience, Aman has positioned Nadcab Labs as one of the most advanced engineering companies driving the next era of intelligent, secure, and scalable software systems. Under his leadership, Nadcab Labs has built 2,000+ global projects across sectors including fintech, banking, healthcare, real estate, logistics, gaming, manufacturing, and next-generation DePIN networks. Aman’s strength lies in architecting high-performance systems, end-to-end platform engineering, and designing enterprise solutions that operate at global scale.